

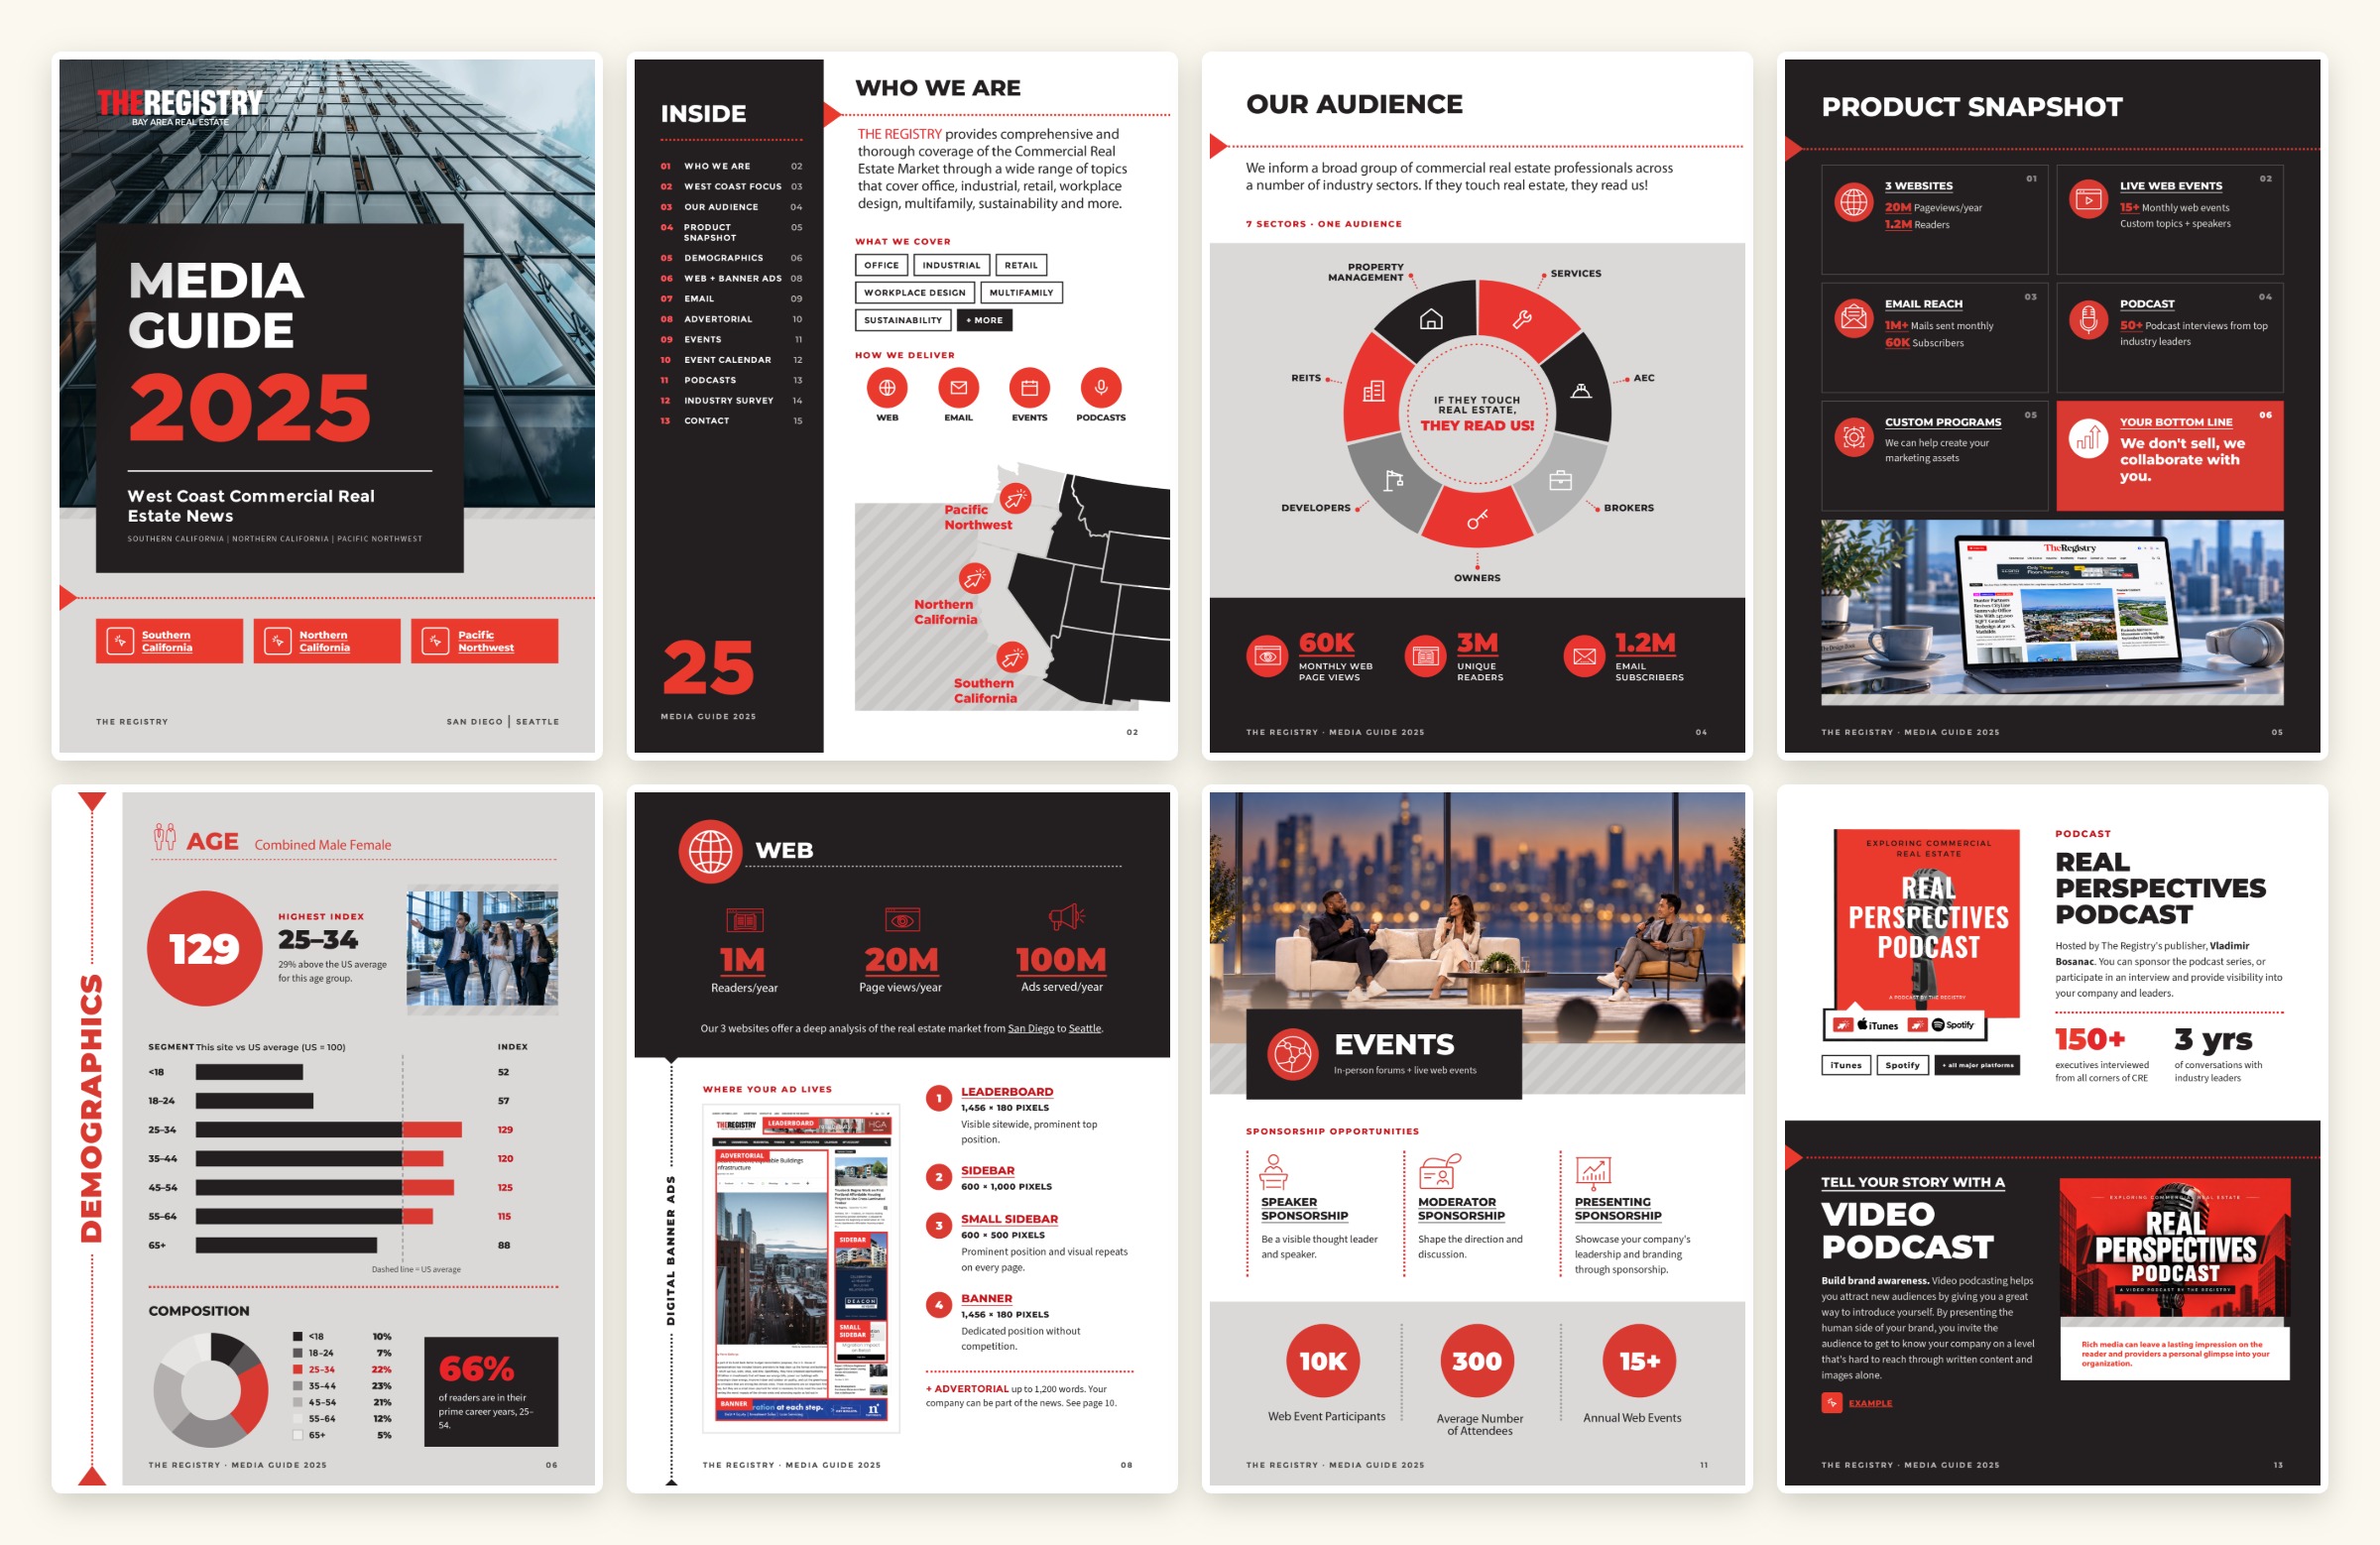
A media guide built to be scanned, not read
A 15-page media guide and two one-page infographics for The Registry, West Coast commercial real estate news — one brand system, three formats.
The Registry sells reach across three markets. Its media guide had to prove that reach in seconds, not paragraphs.
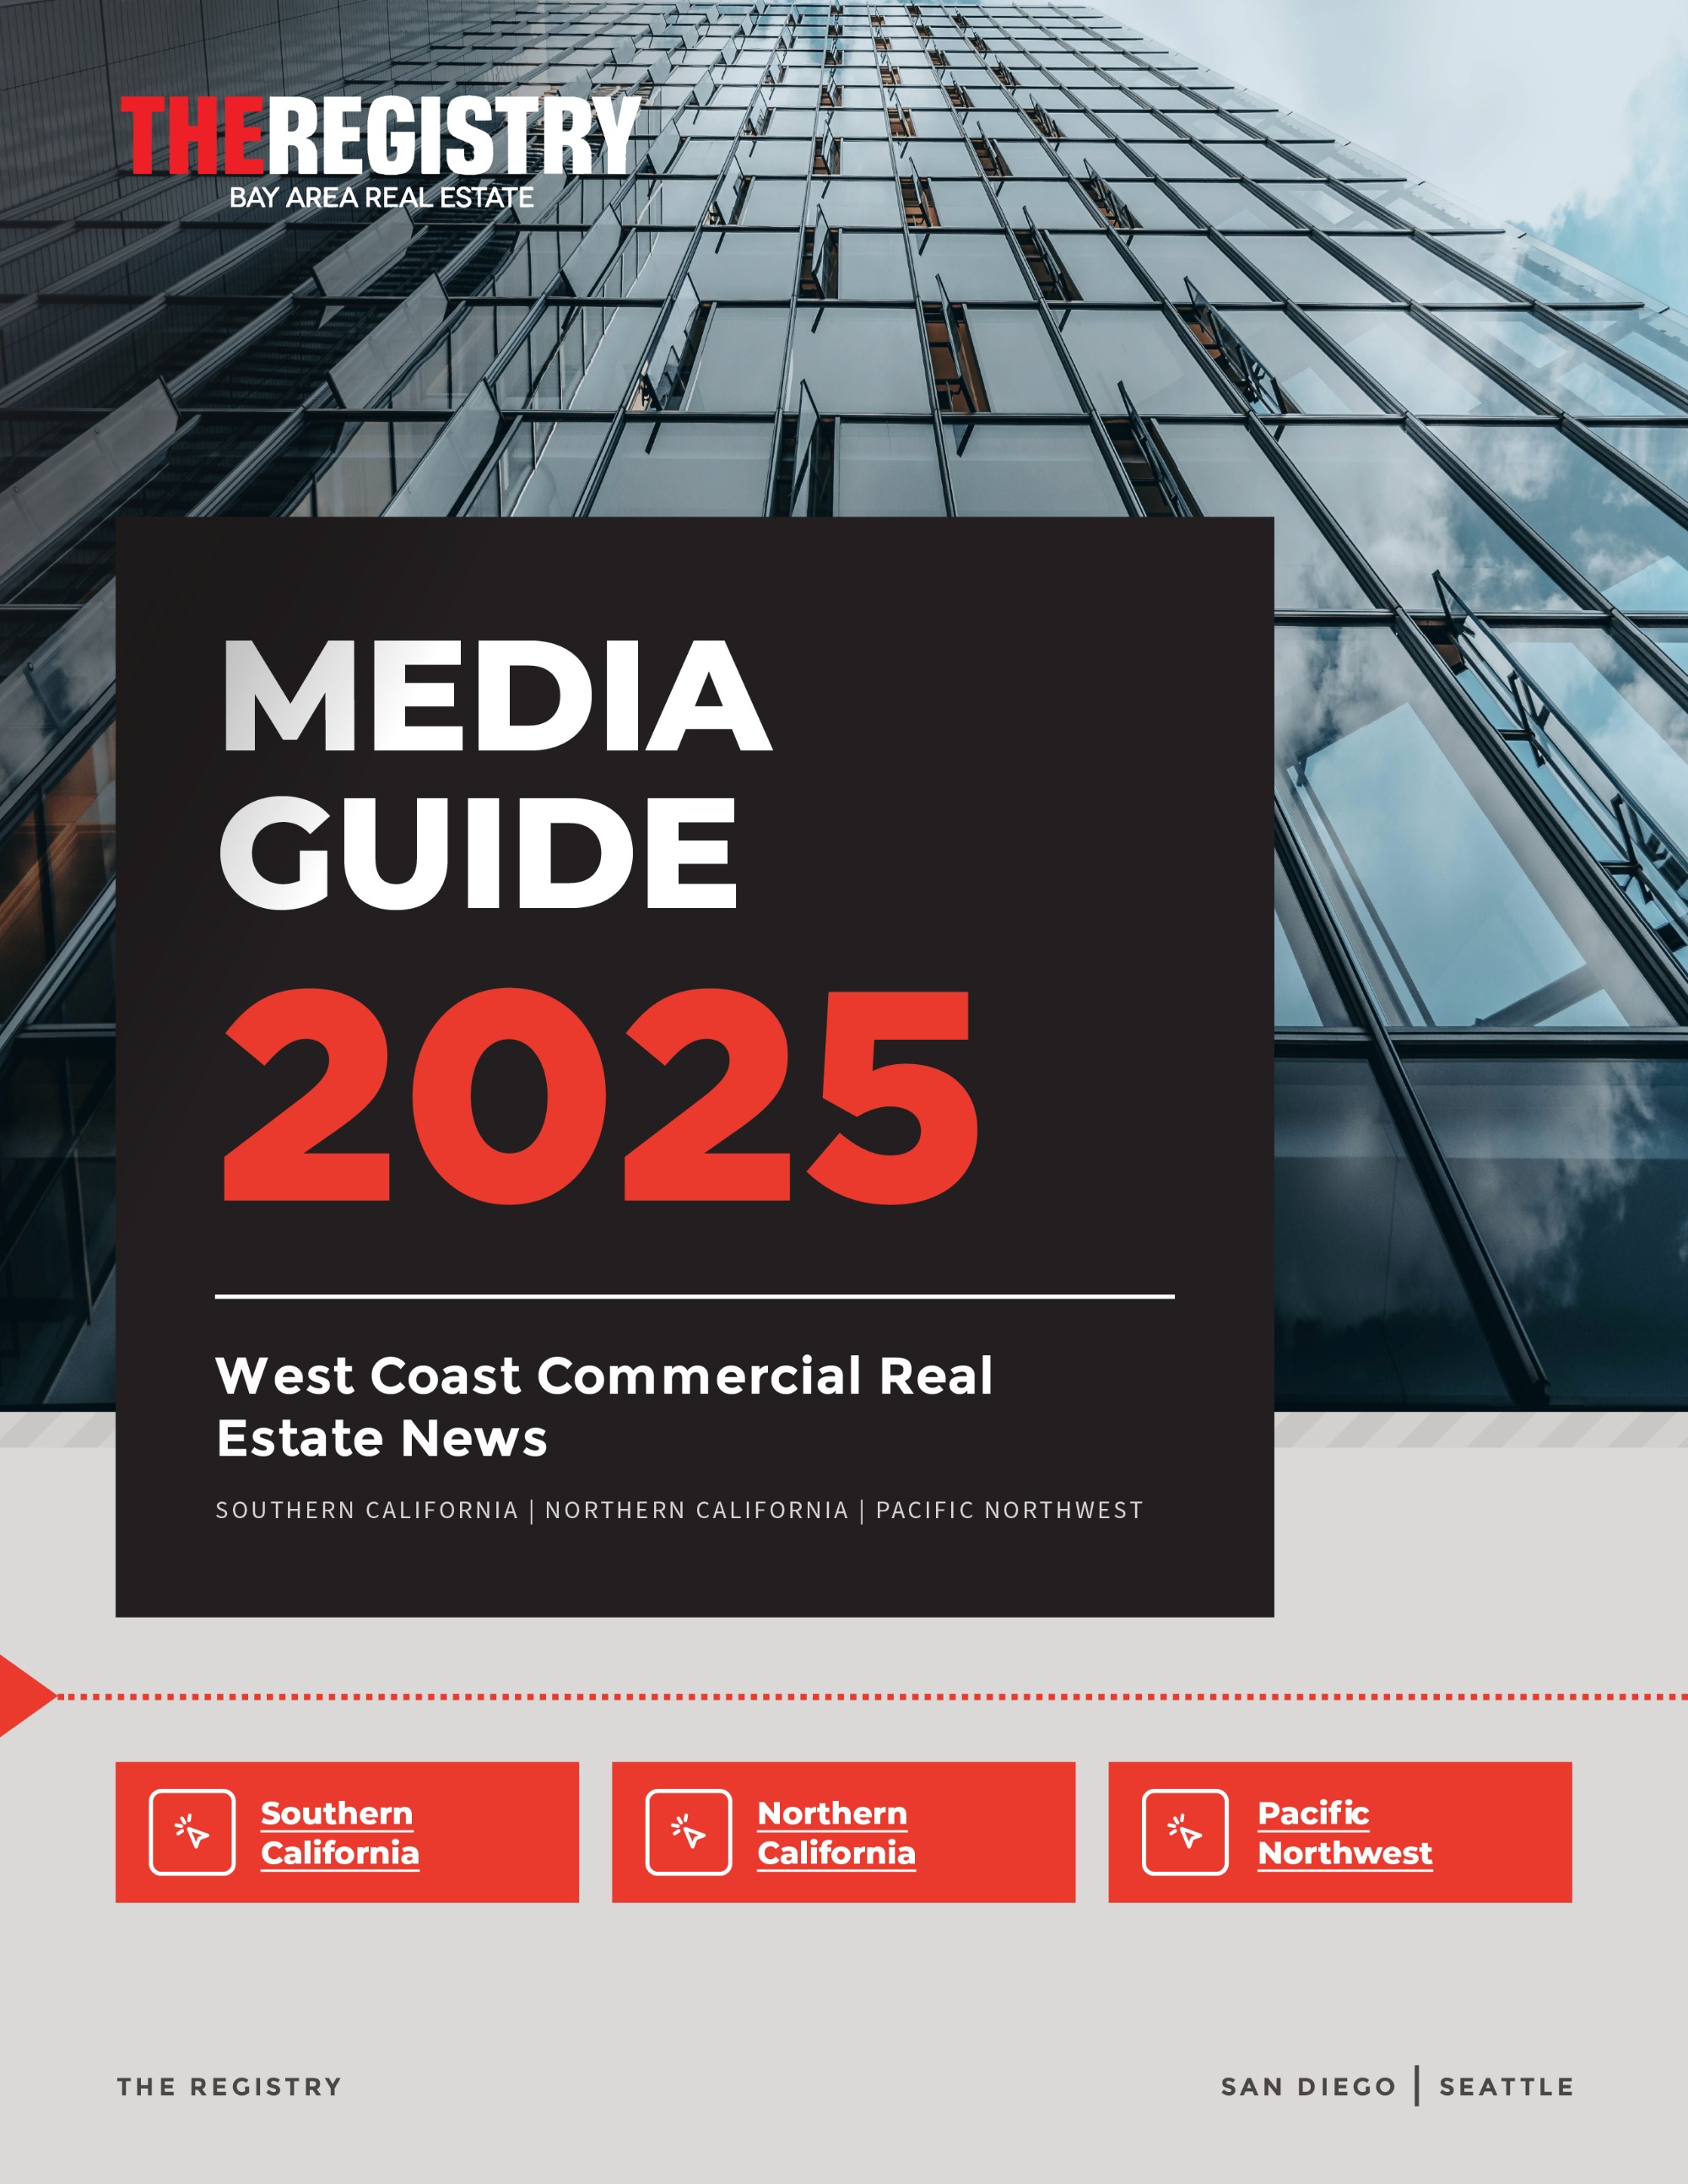
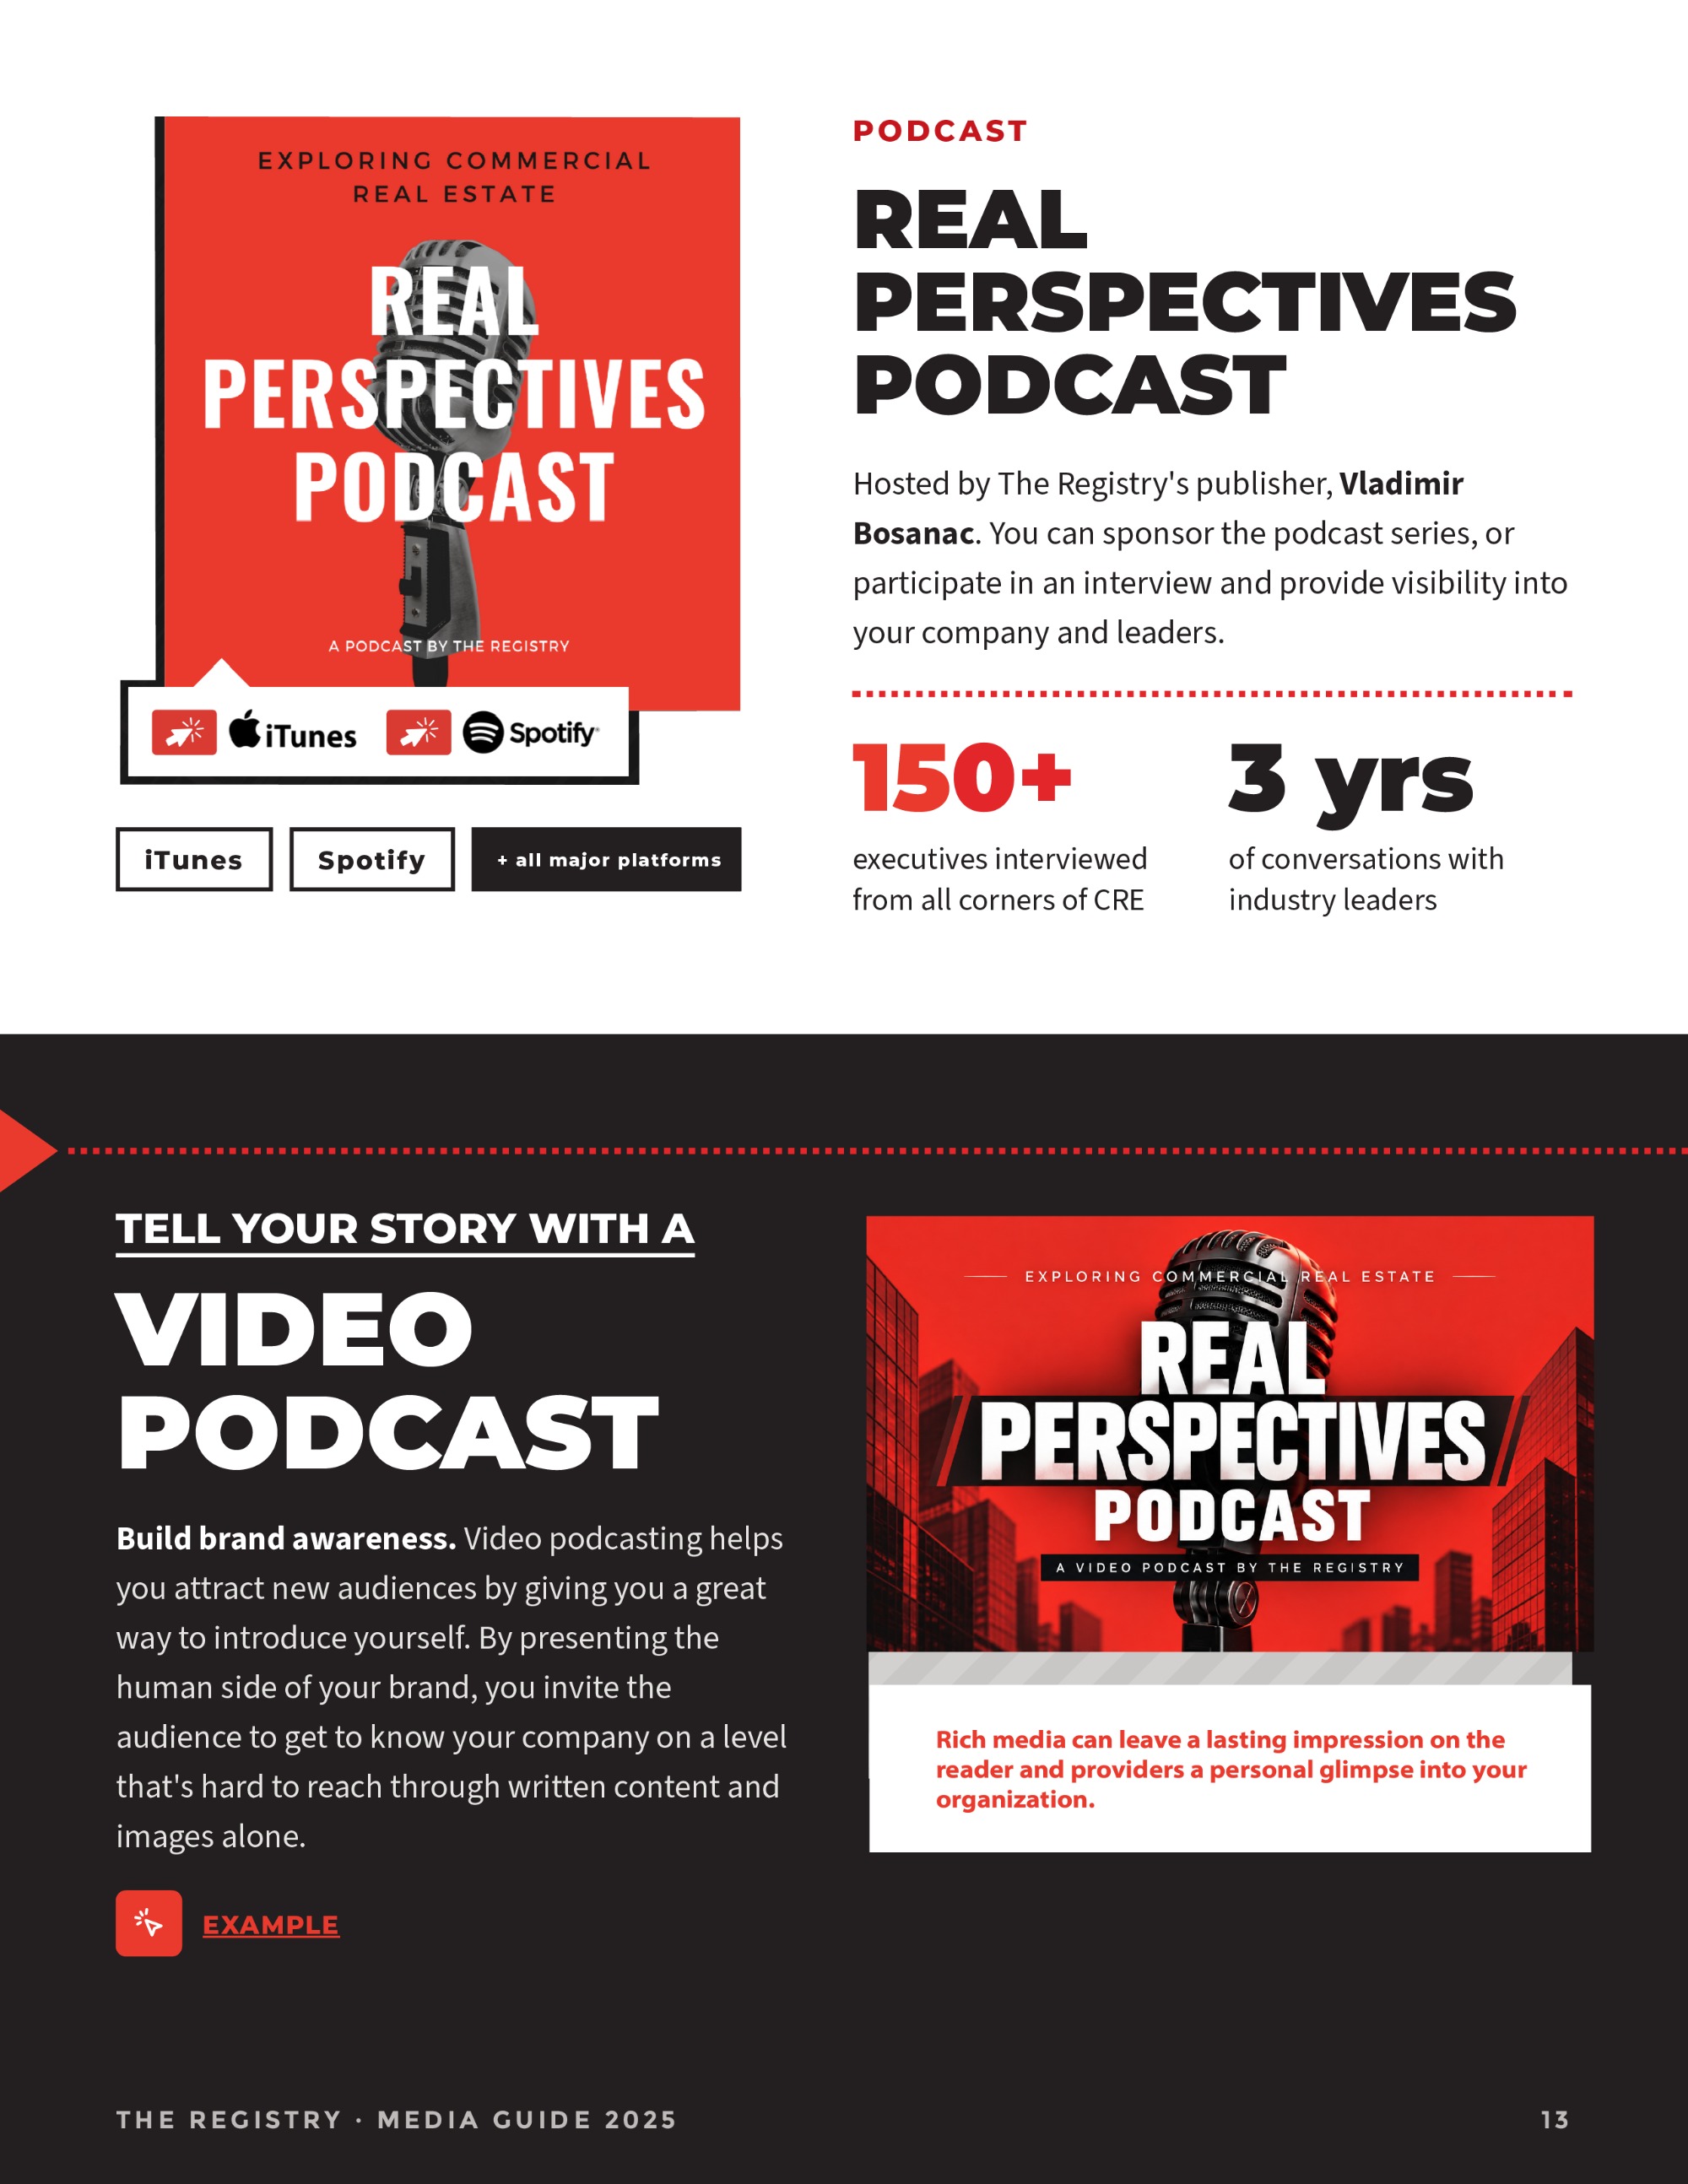
I designed the 2025 media guide as a 15-page report: audience, demographics, ad specs, email products, events, podcasts and contact — each with its own page and its own visual logic.
I then condensed the same content into one-page infographics for the web: a long-form 2024 version and a tighter 2025 version built for quick scrolling.
A media guide is a sales document. If an advertiser can't find the number they need, the page has failed.
The West Coast's CRE newsroom
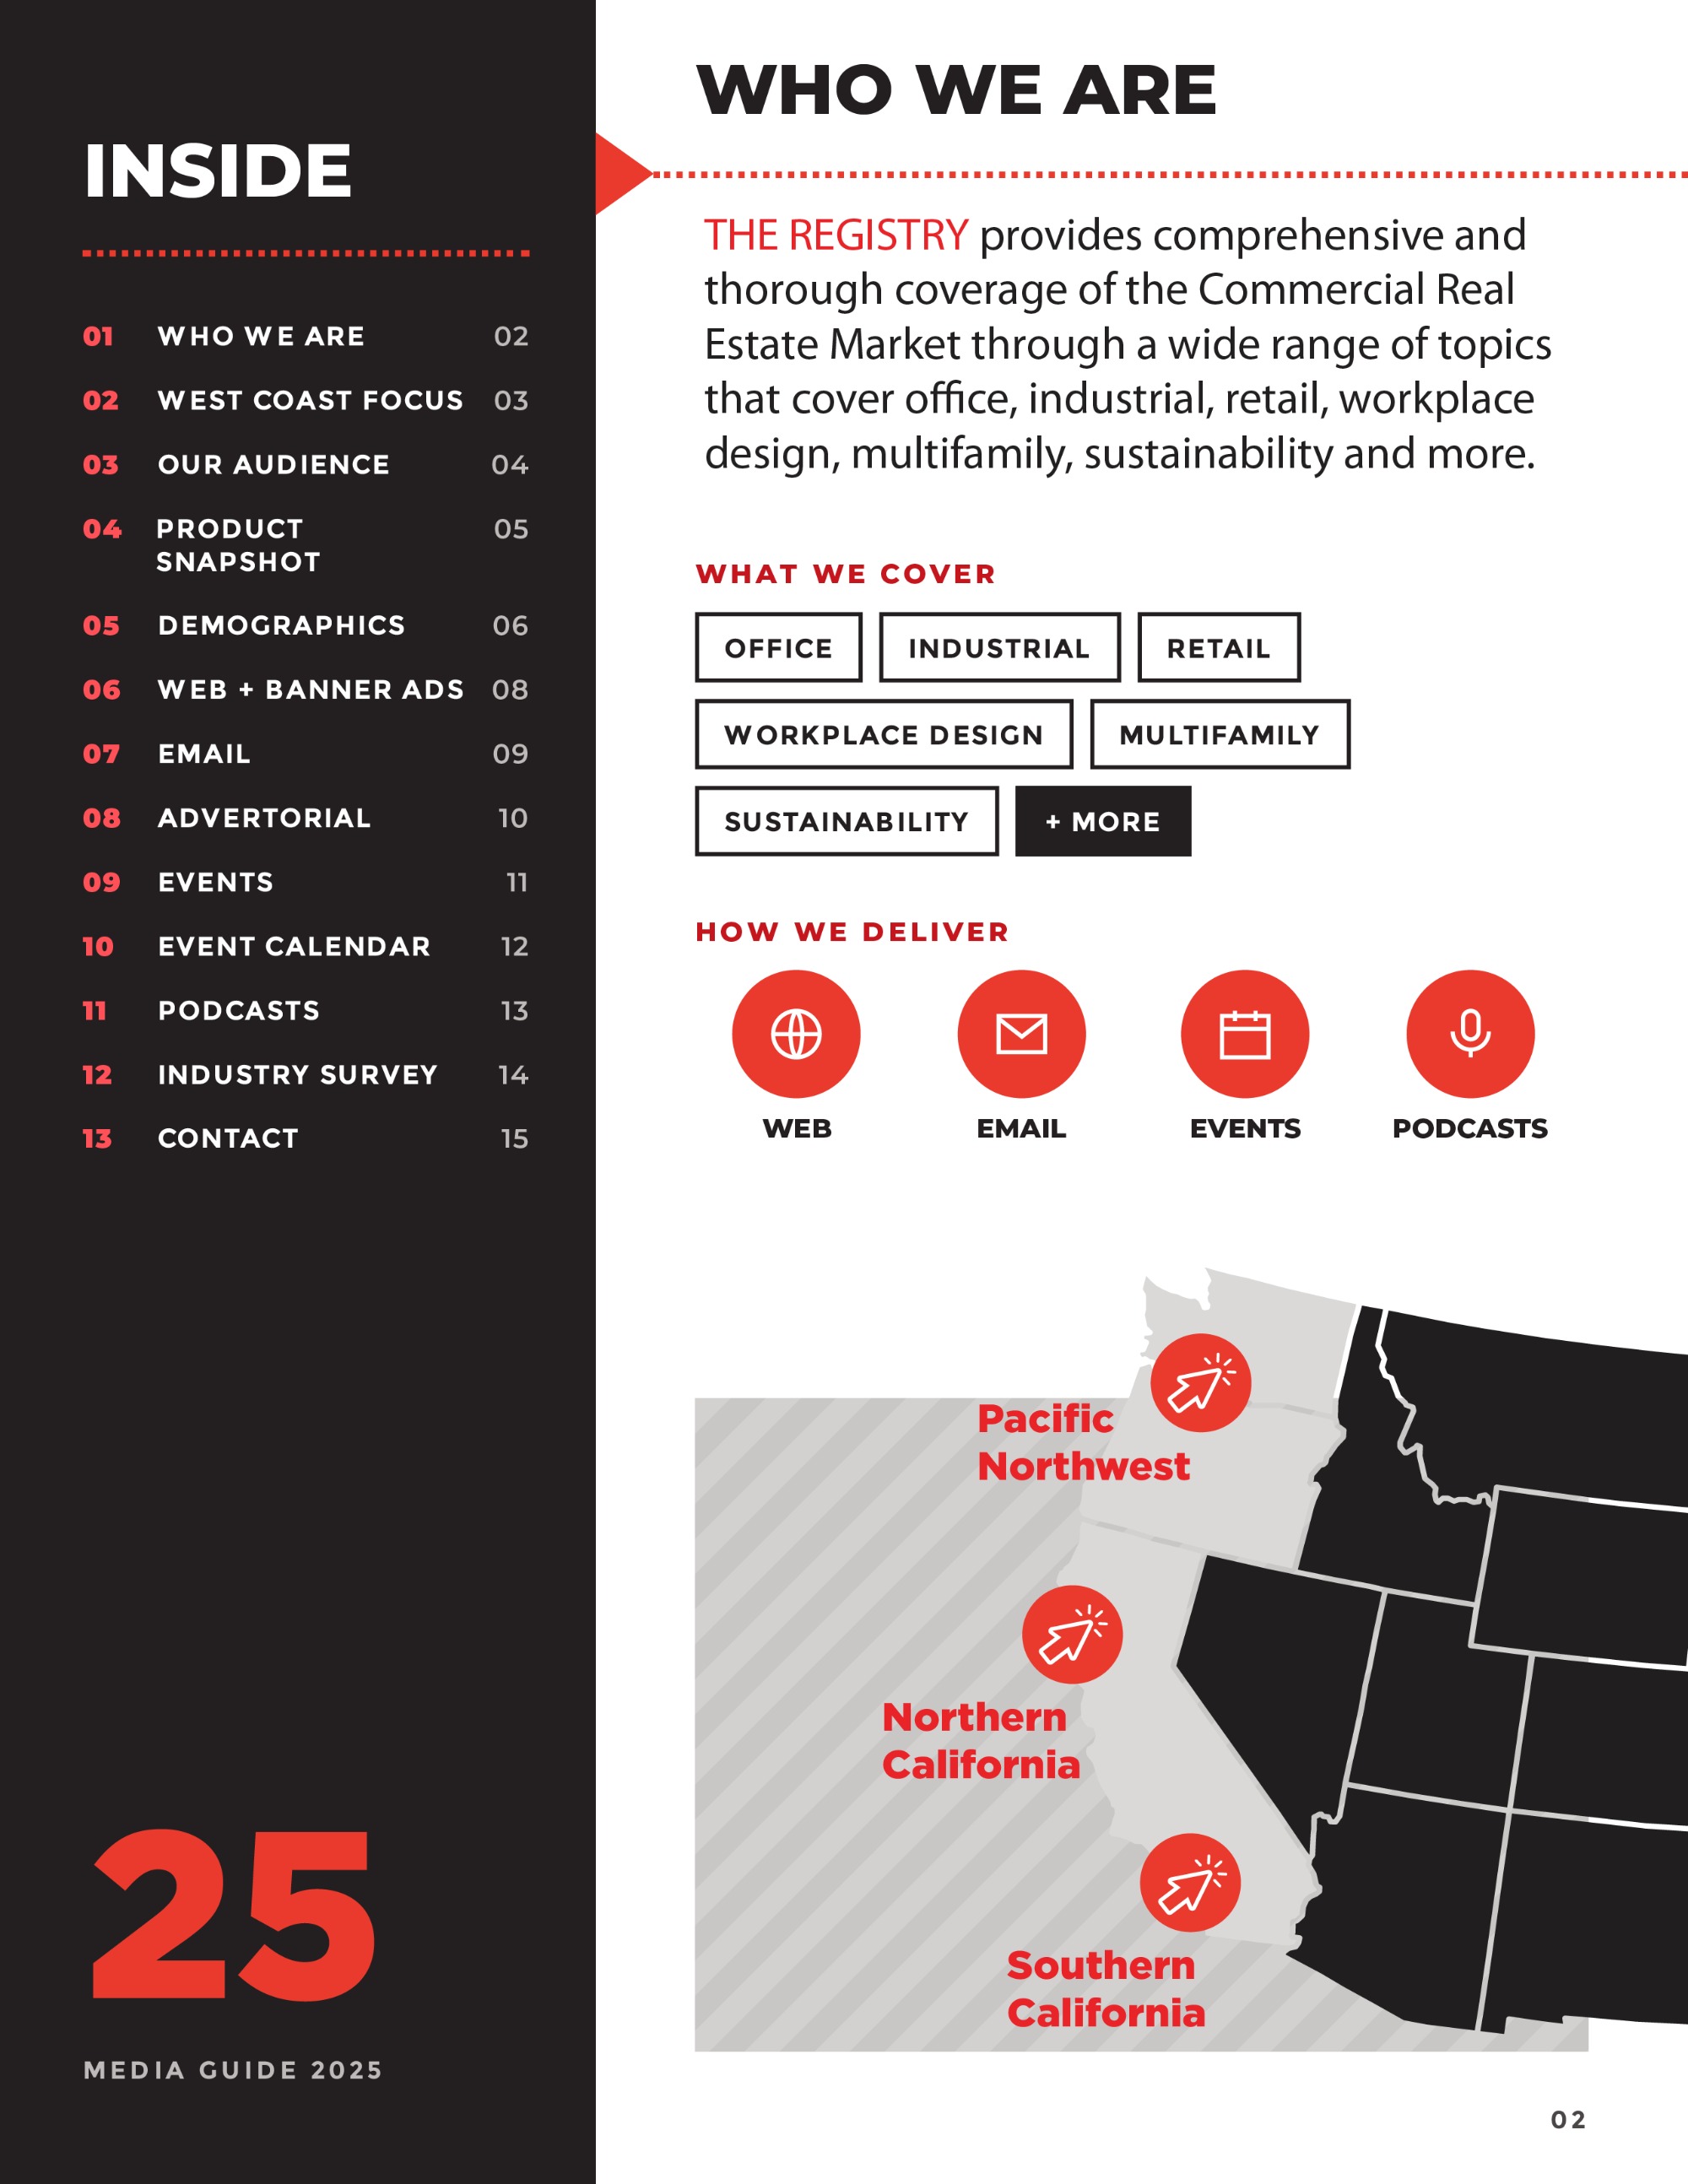
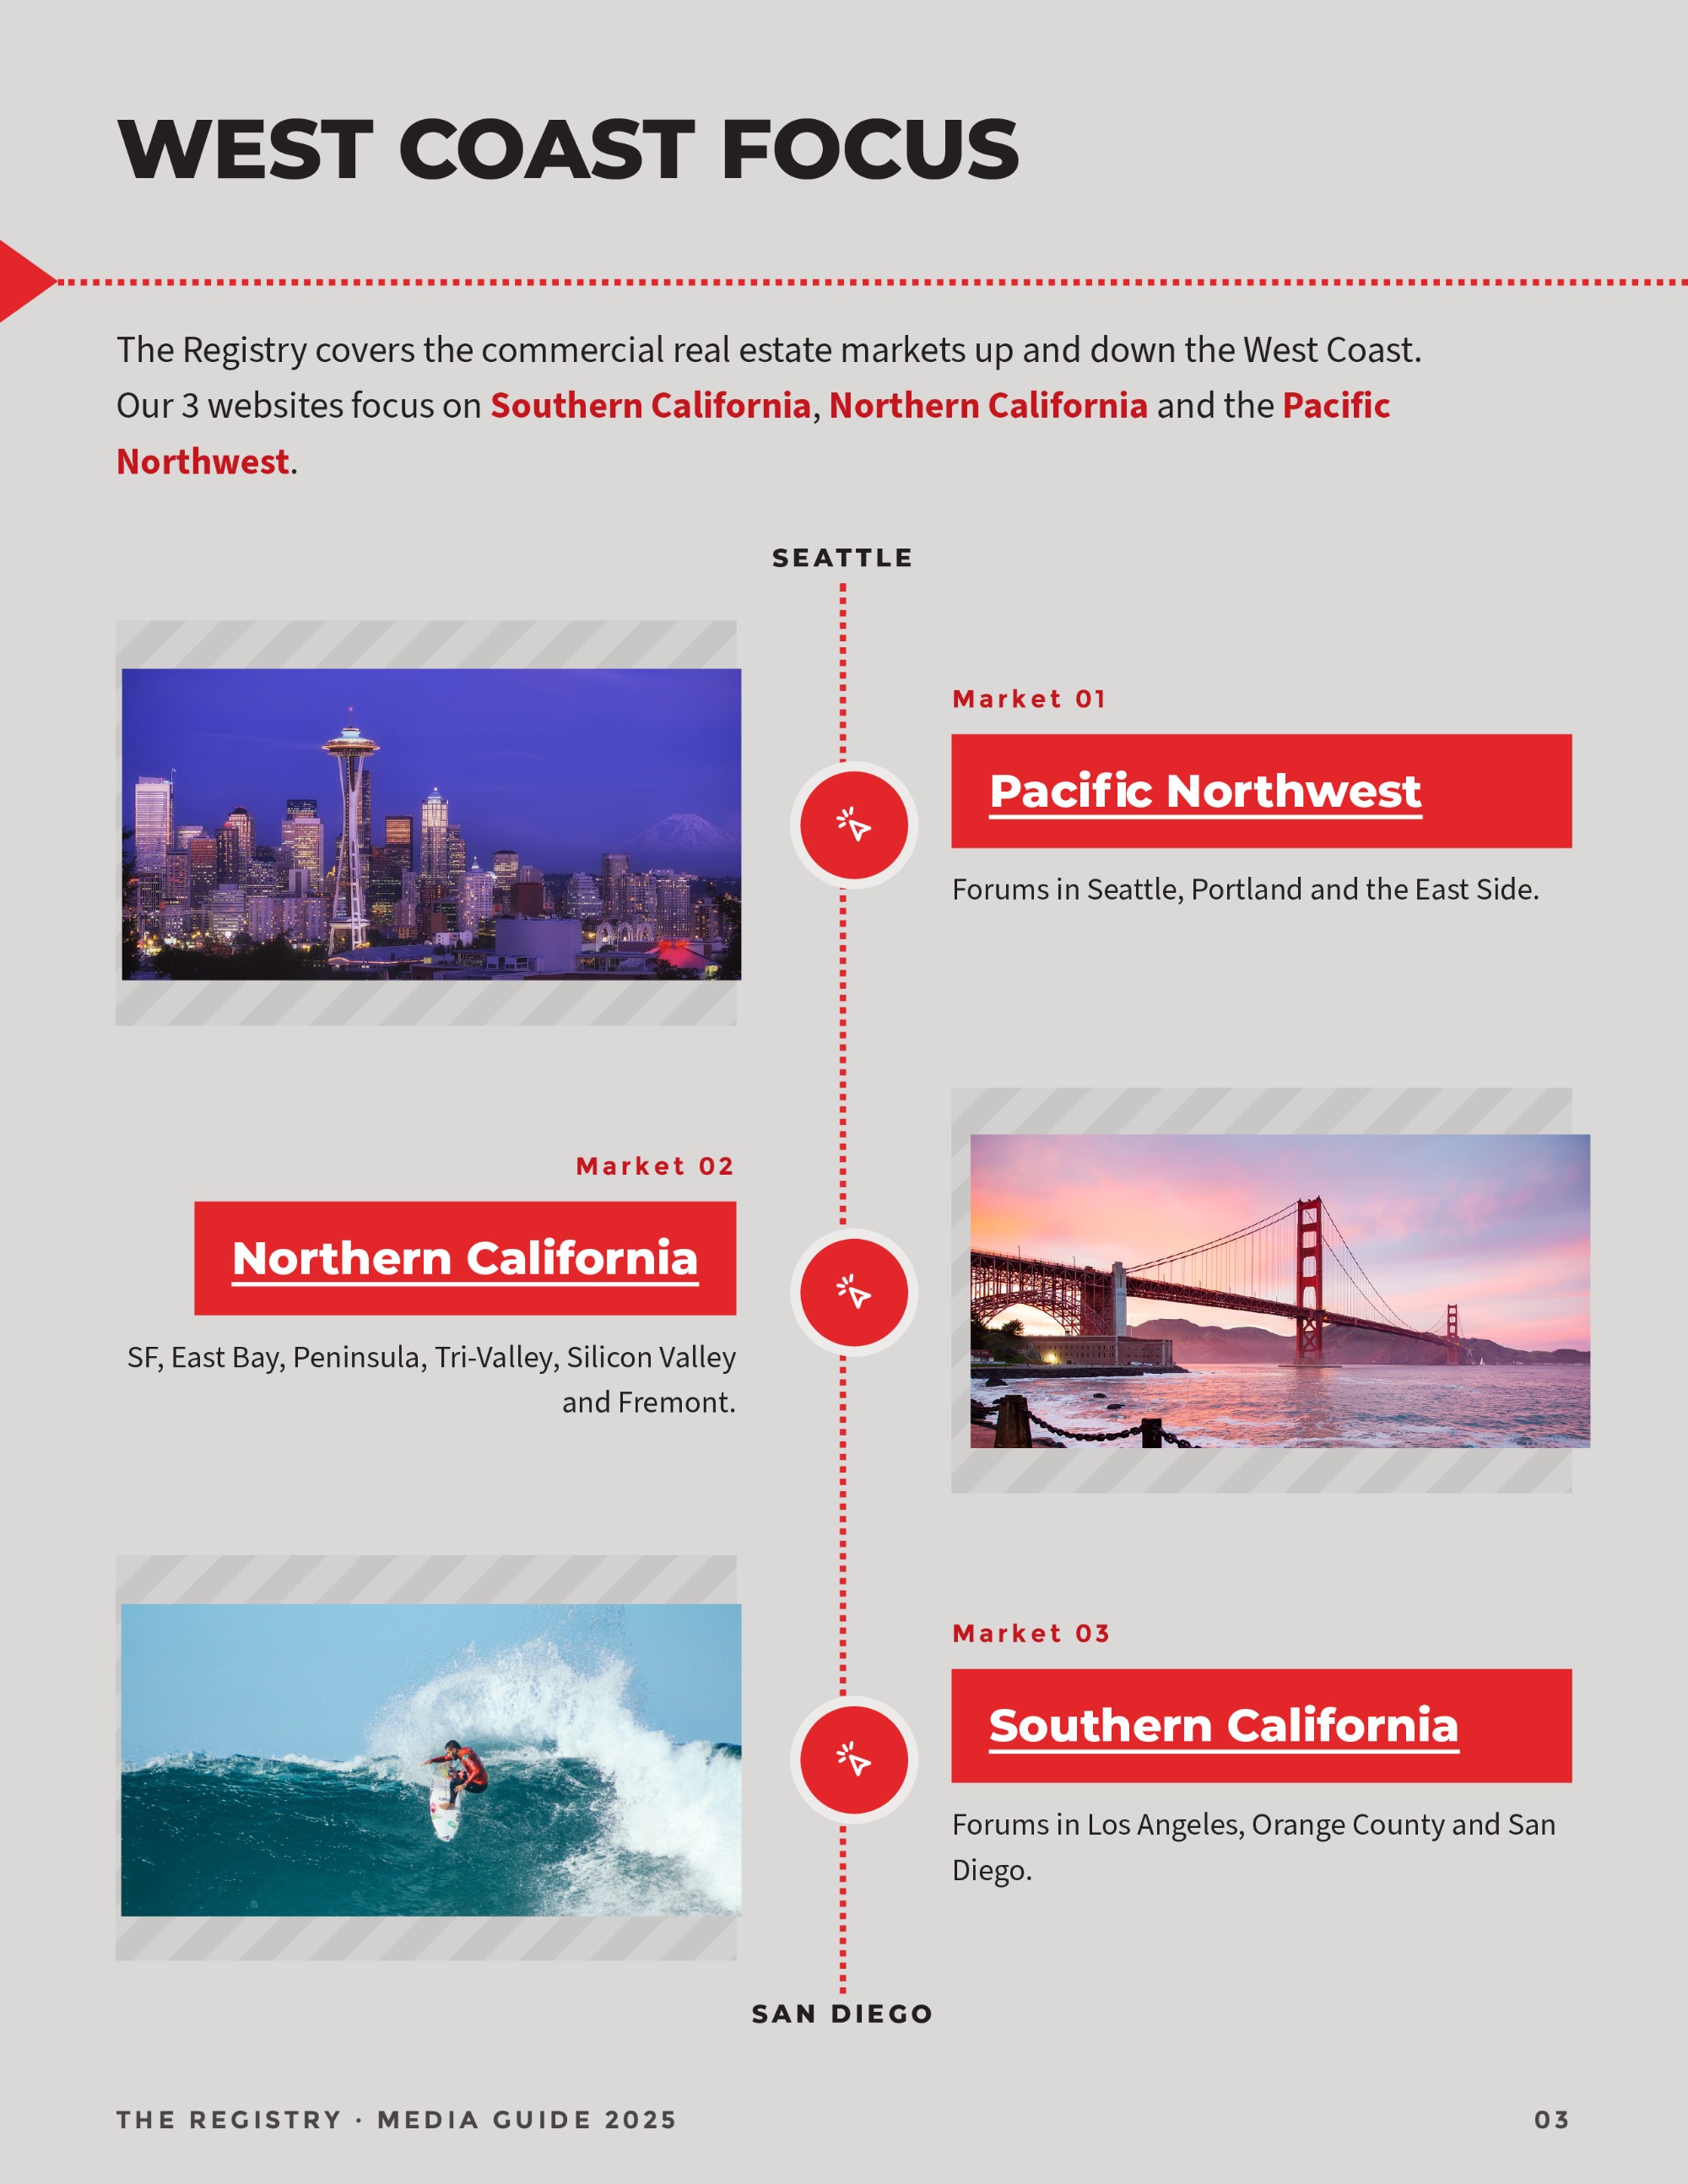
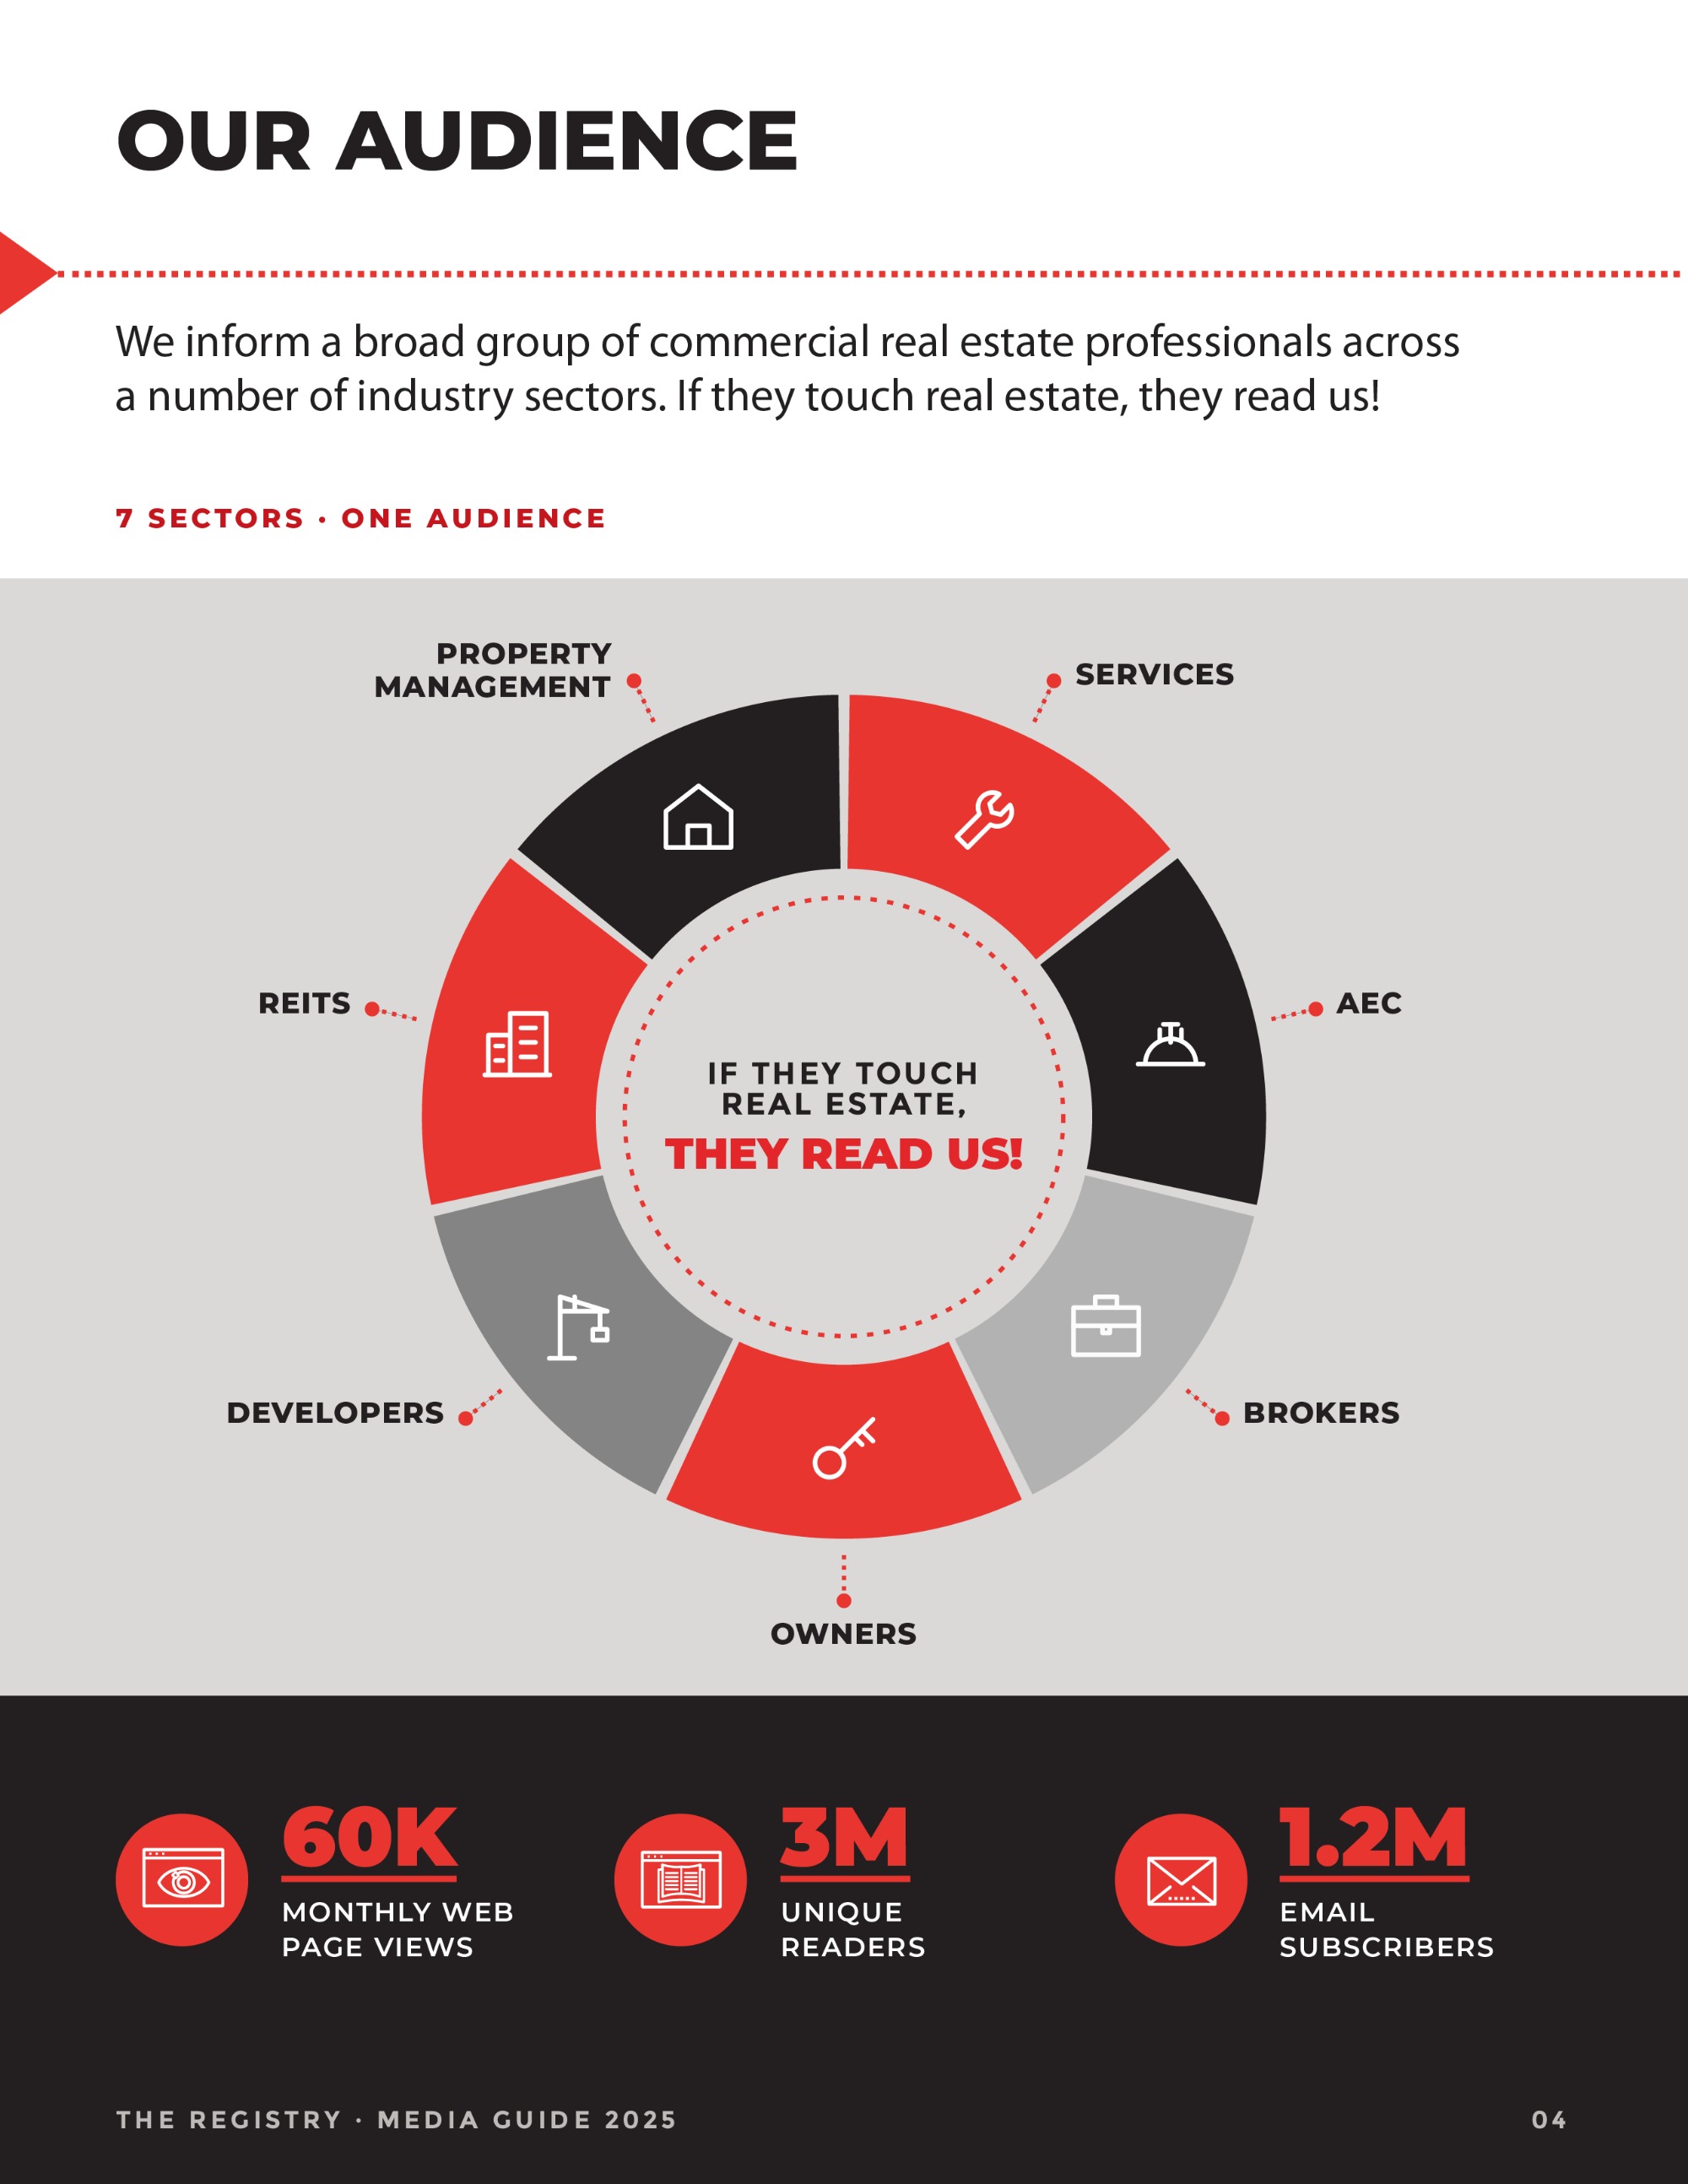
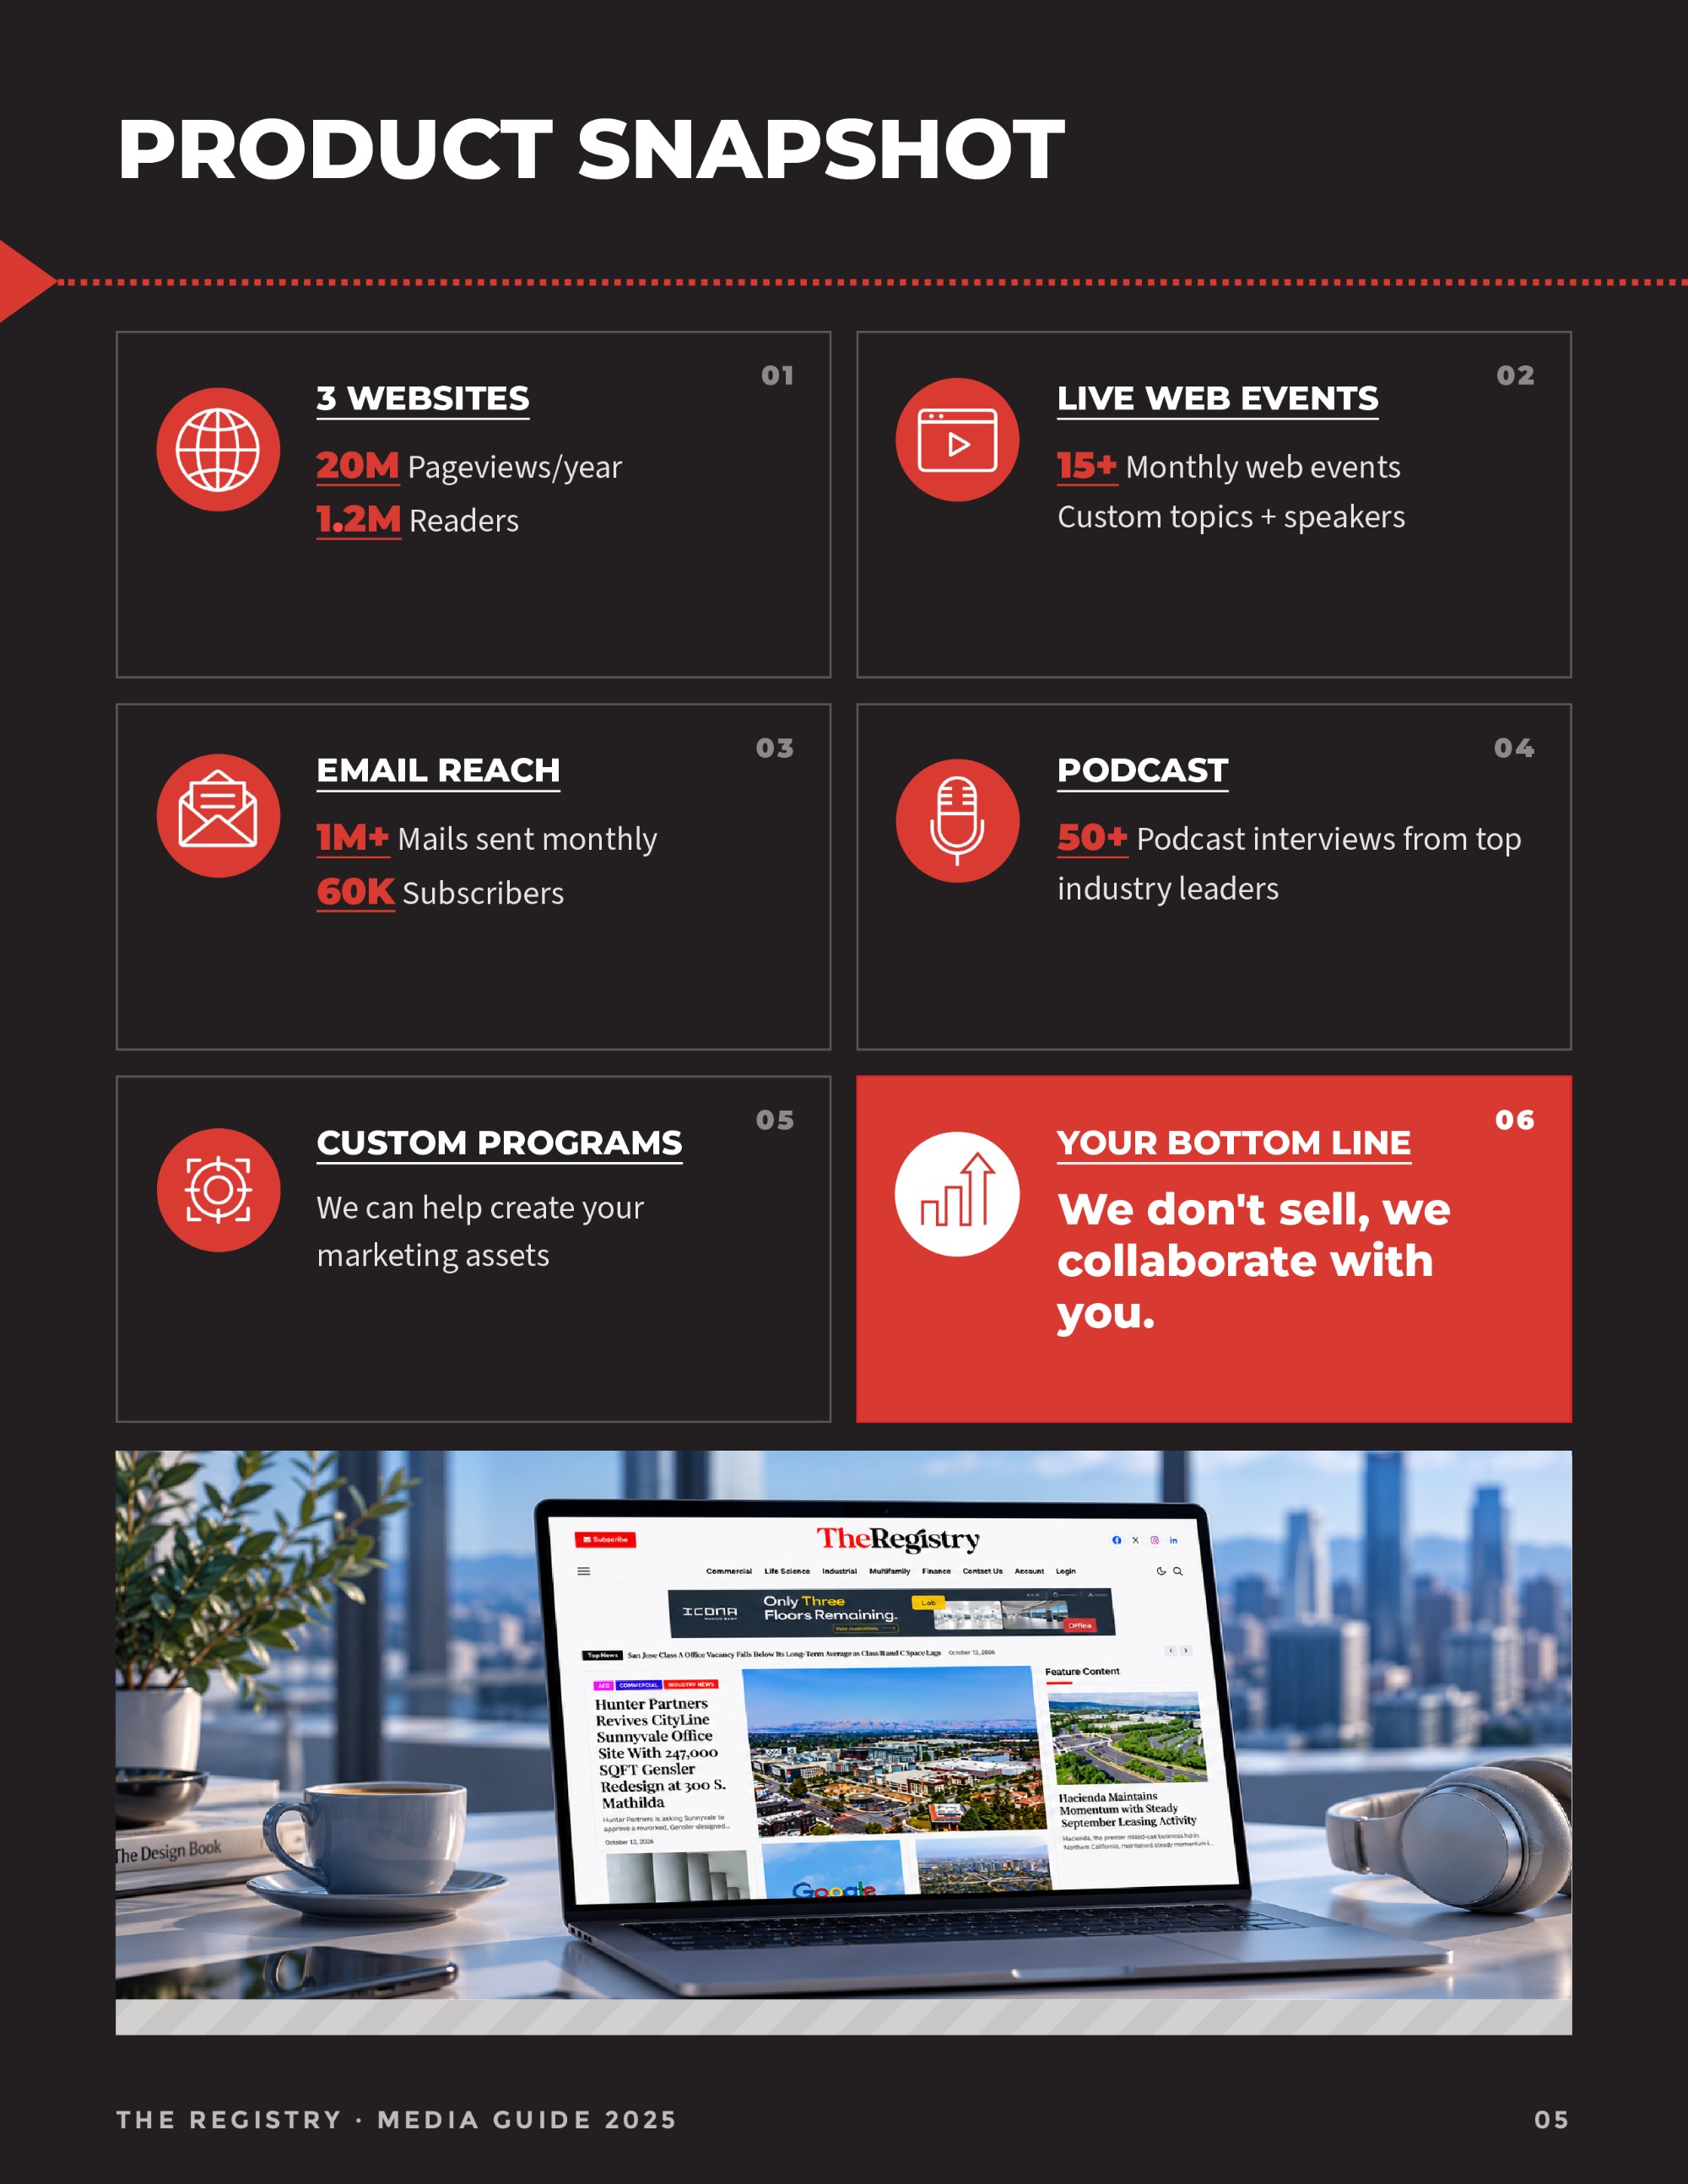
The Registry covers commercial real estate from San Diego to Seattle through three regional websites, daily and weekly email, live forums, web events and a podcast.
Its media guide is the document sales hands to every prospective advertiser.
Six products, one skim
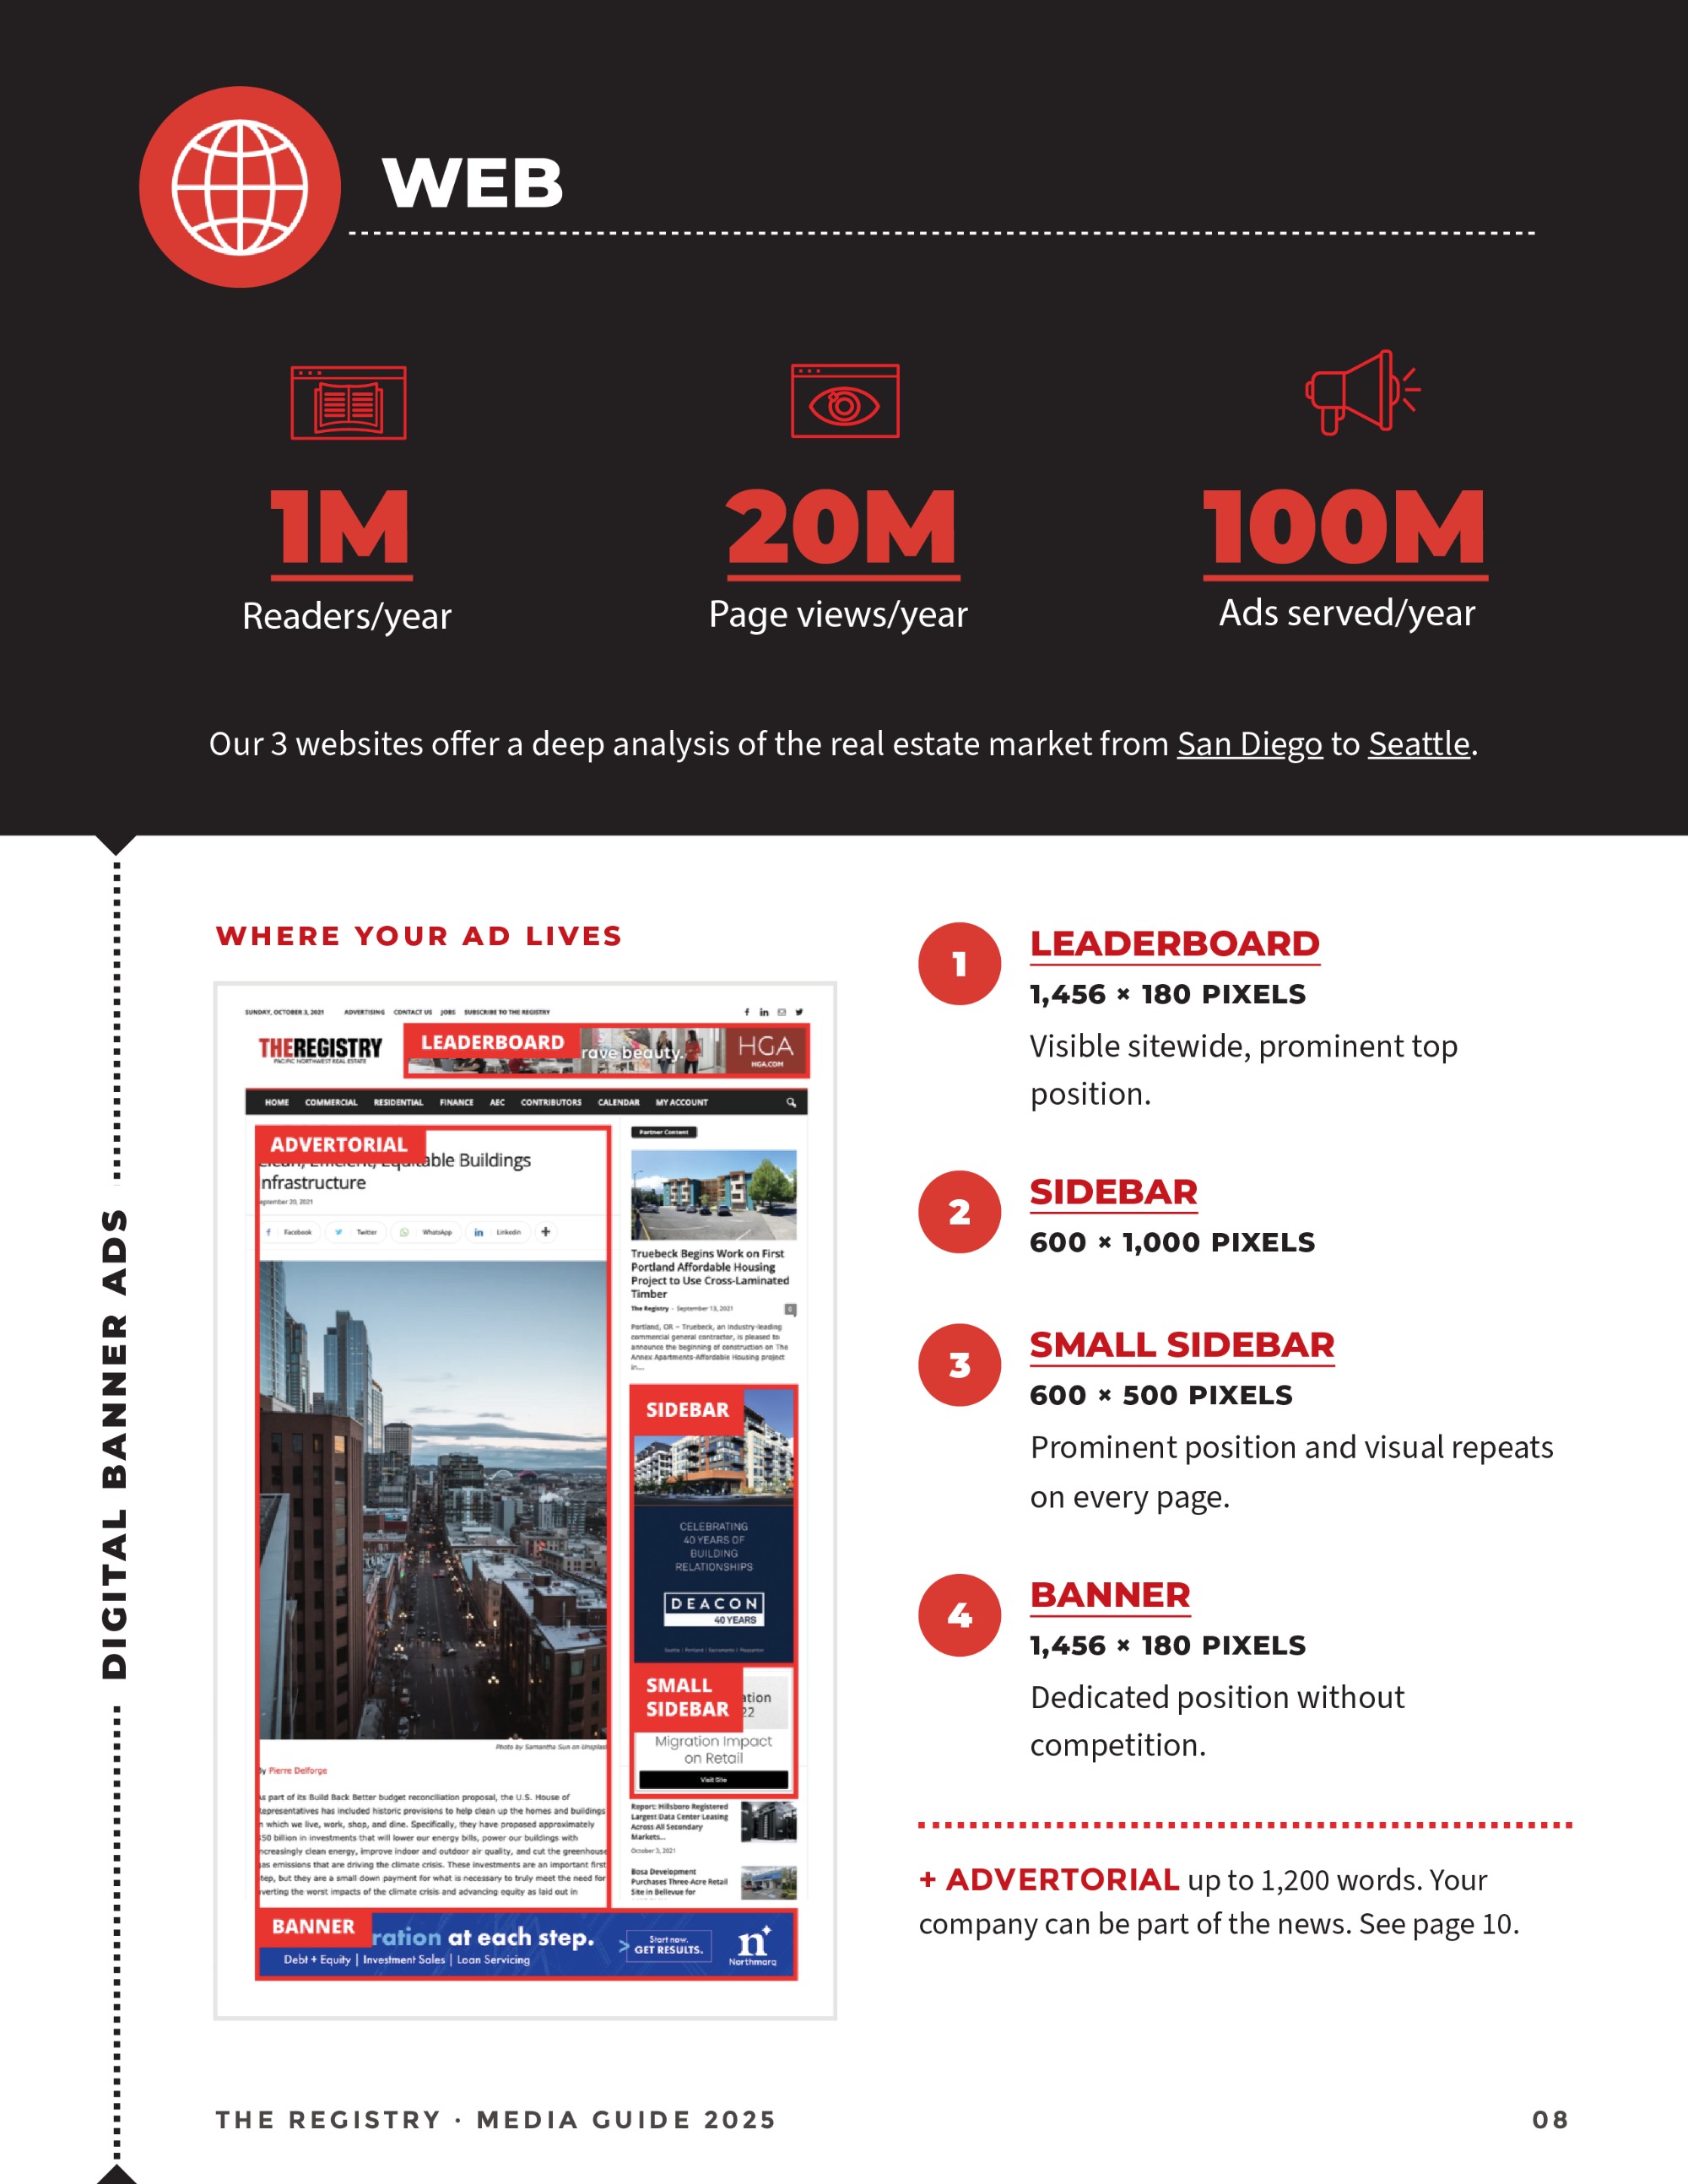
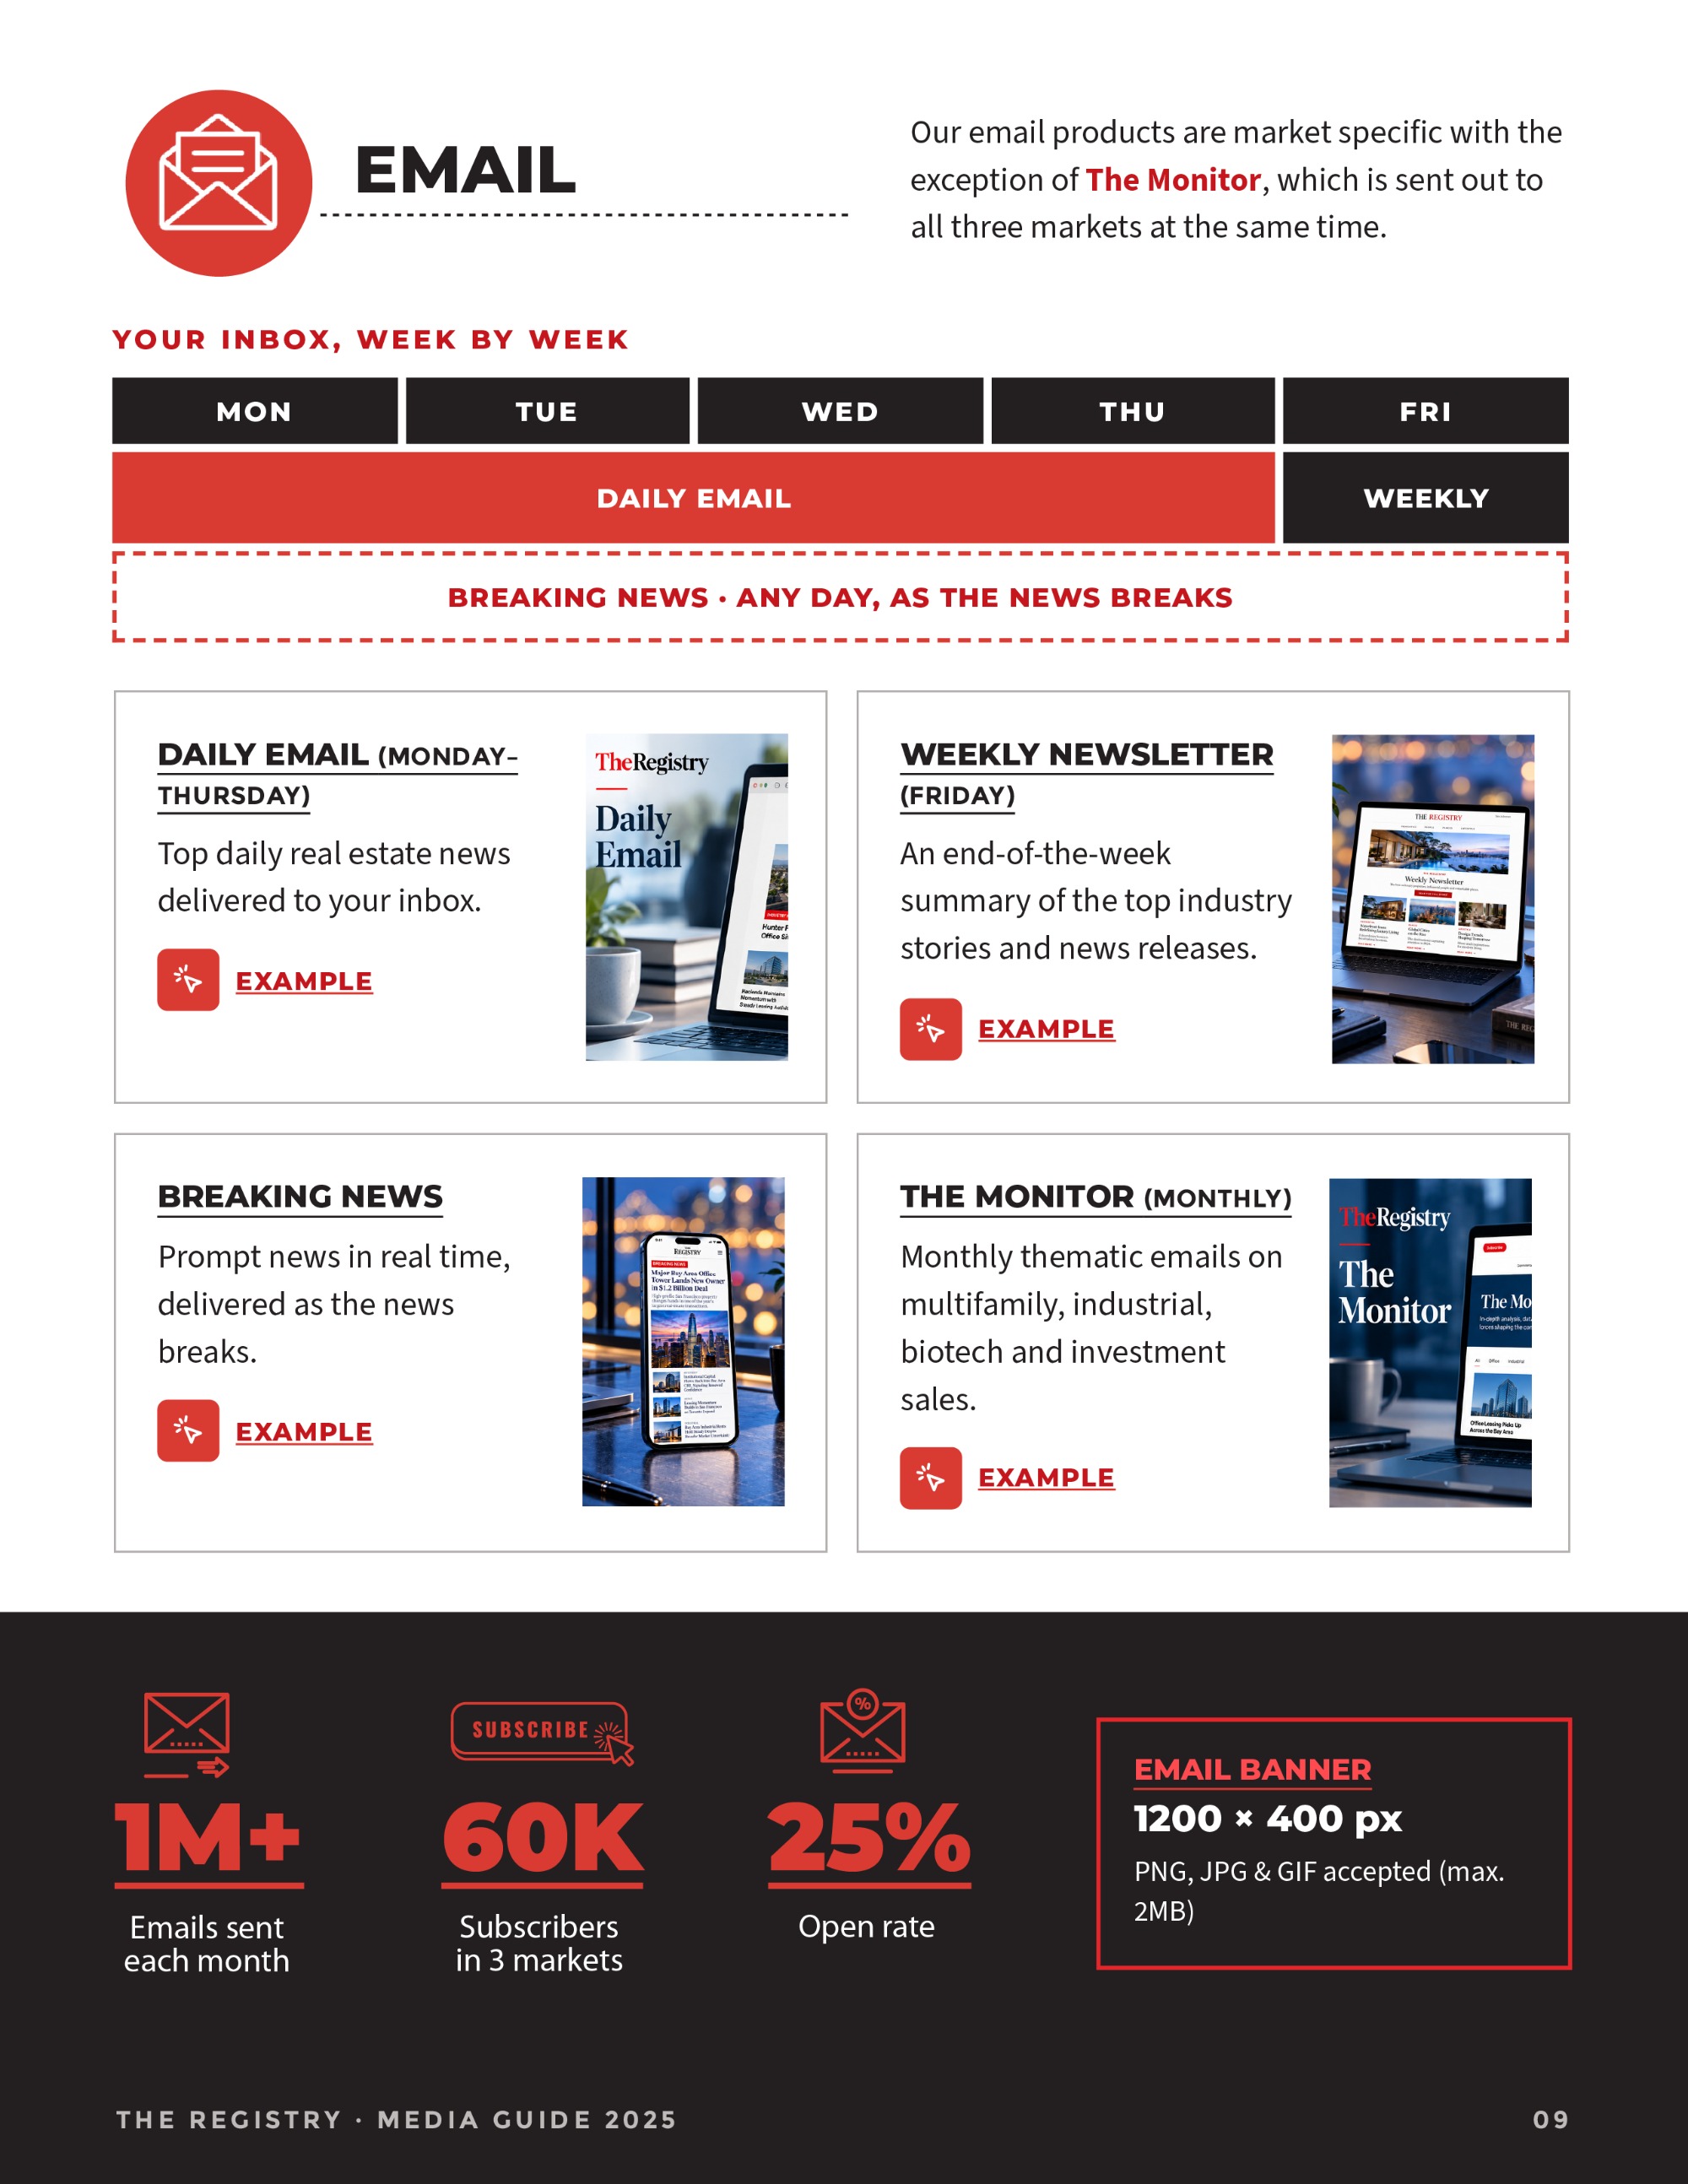
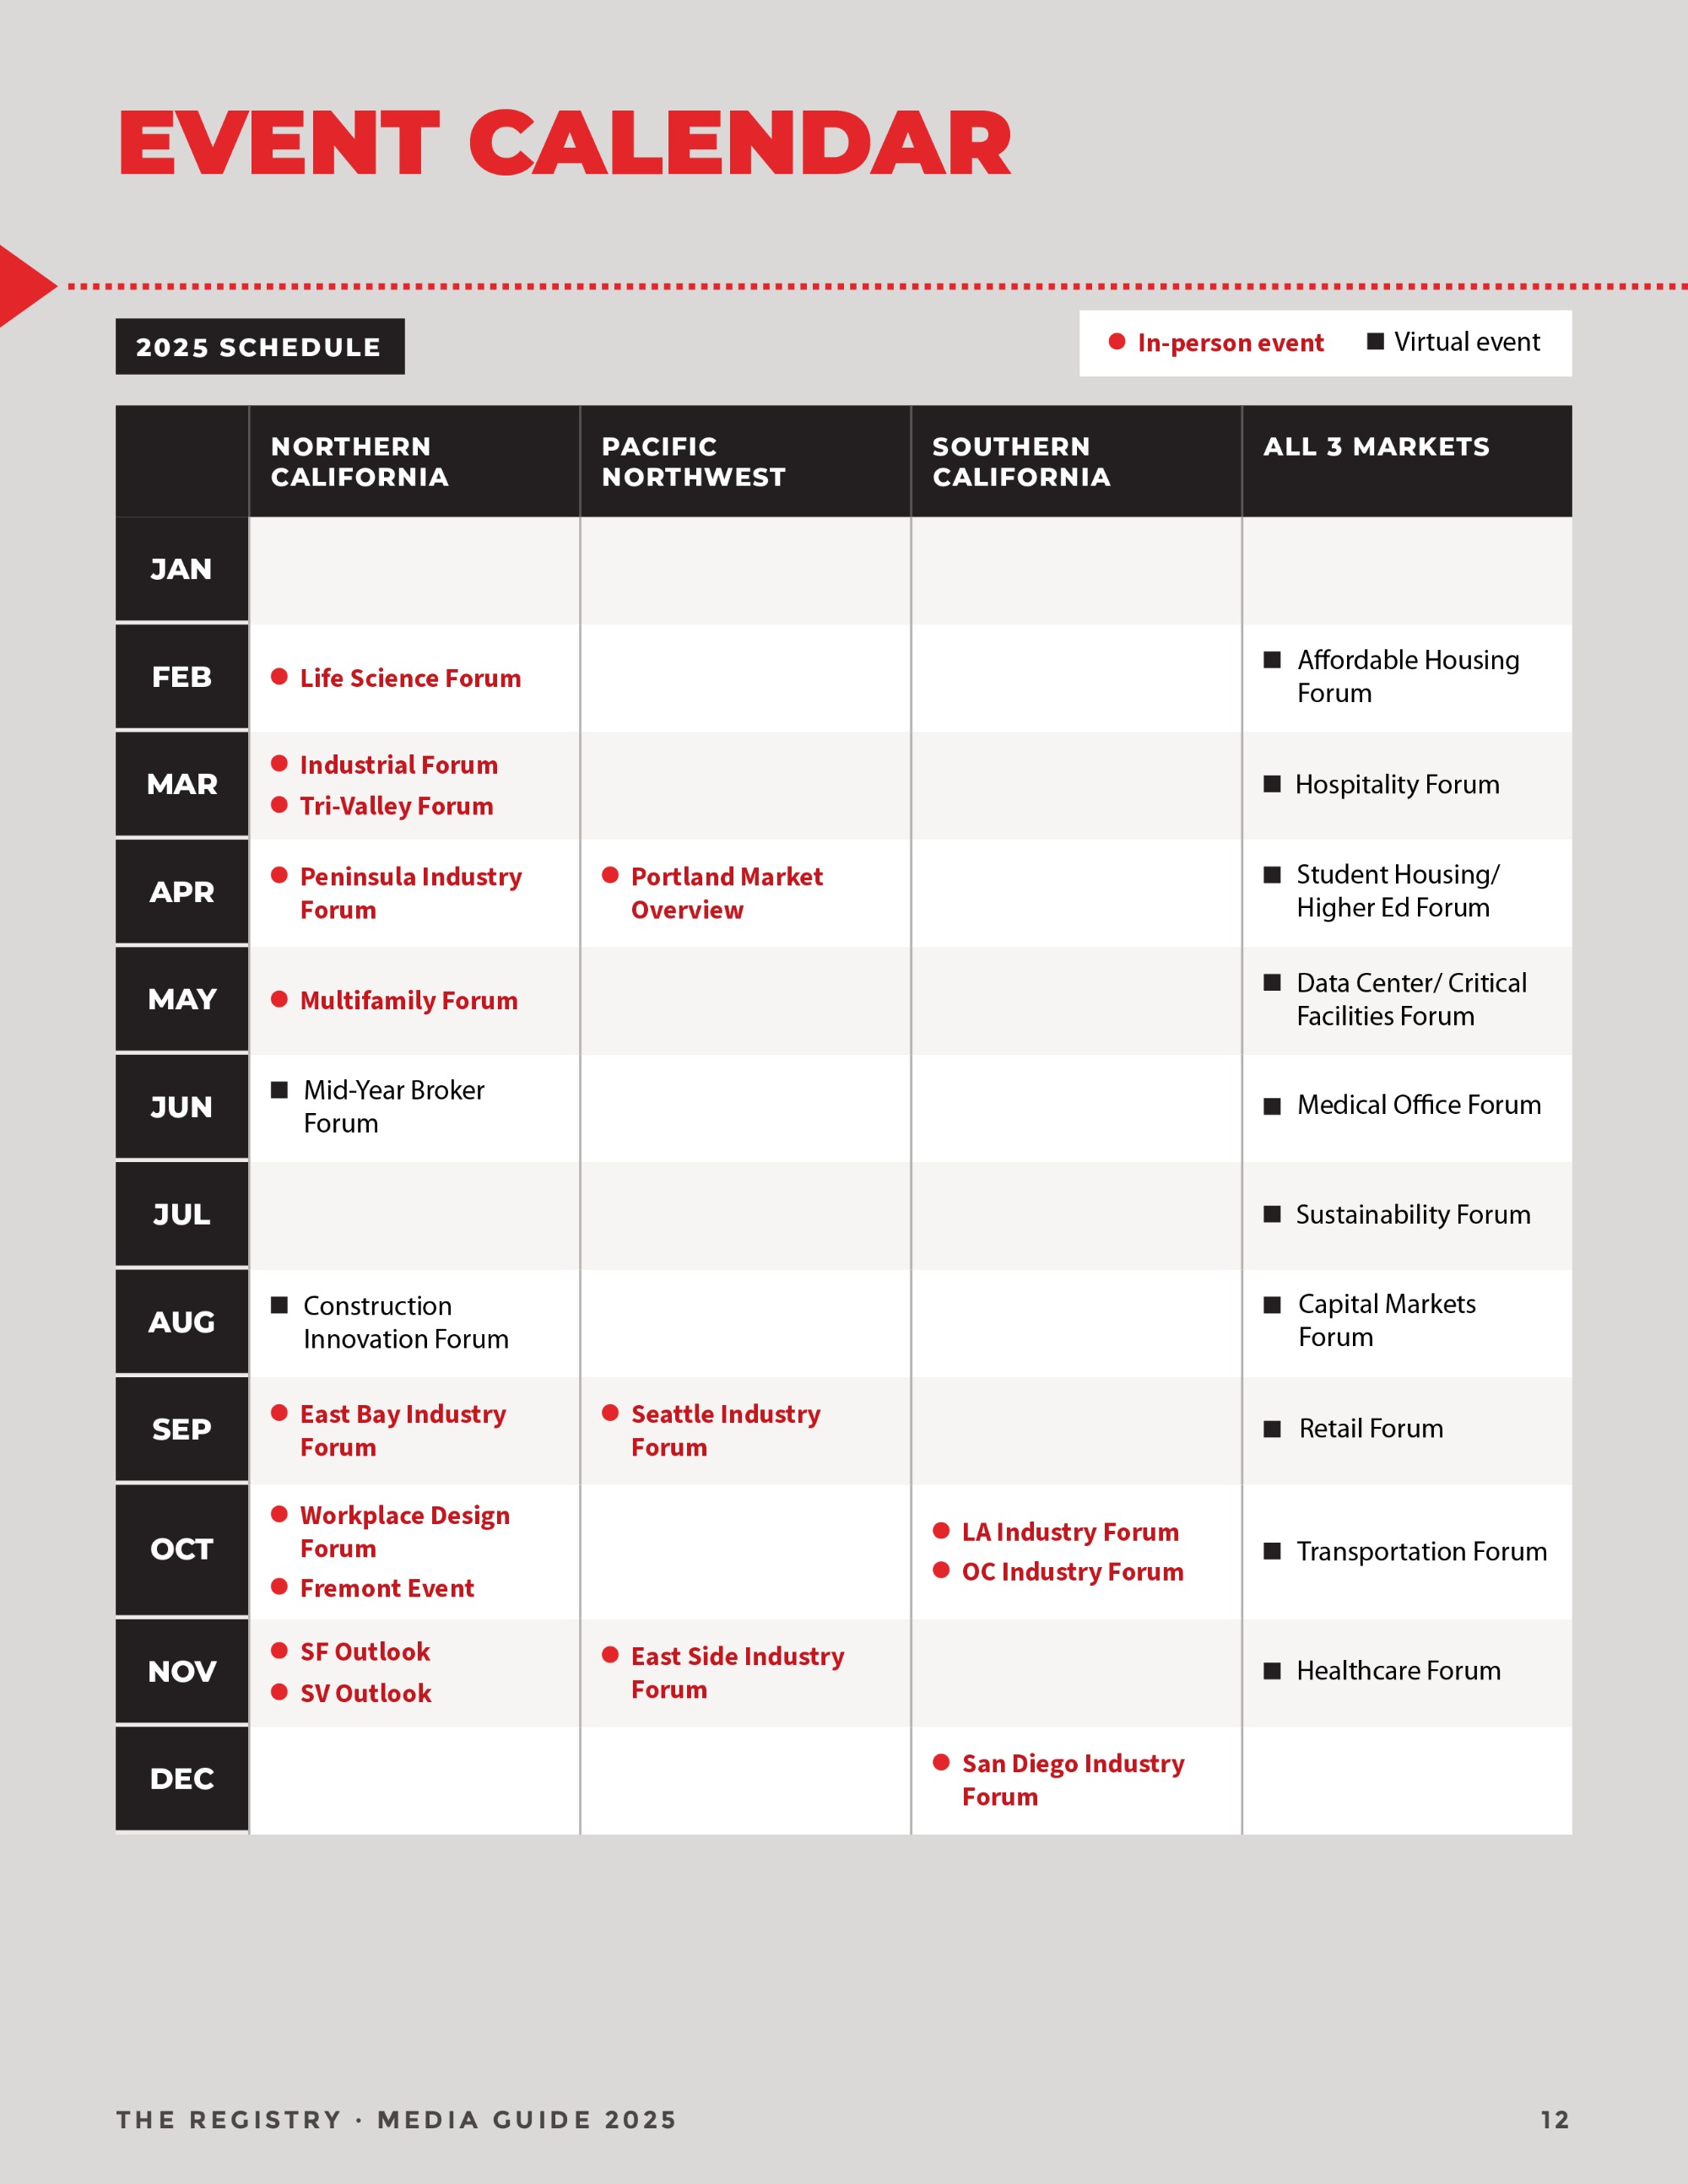
The content was a wall of numbers: pageviews, subscribers, open rates, index scores, pixel specs, a 12-month event calendar across three markets.
Advertisers skim. Each product needed to read as its own offer without the guide feeling like six different documents.
Index scores, compositions and specs that had to stay accurate and comparable.
Southern California, Northern California and the Pacific Northwest, each with its own events.
A paged report and two infographics, all drawn from one content set.
Fifteen pages. One rhythm. Zero walls of text.
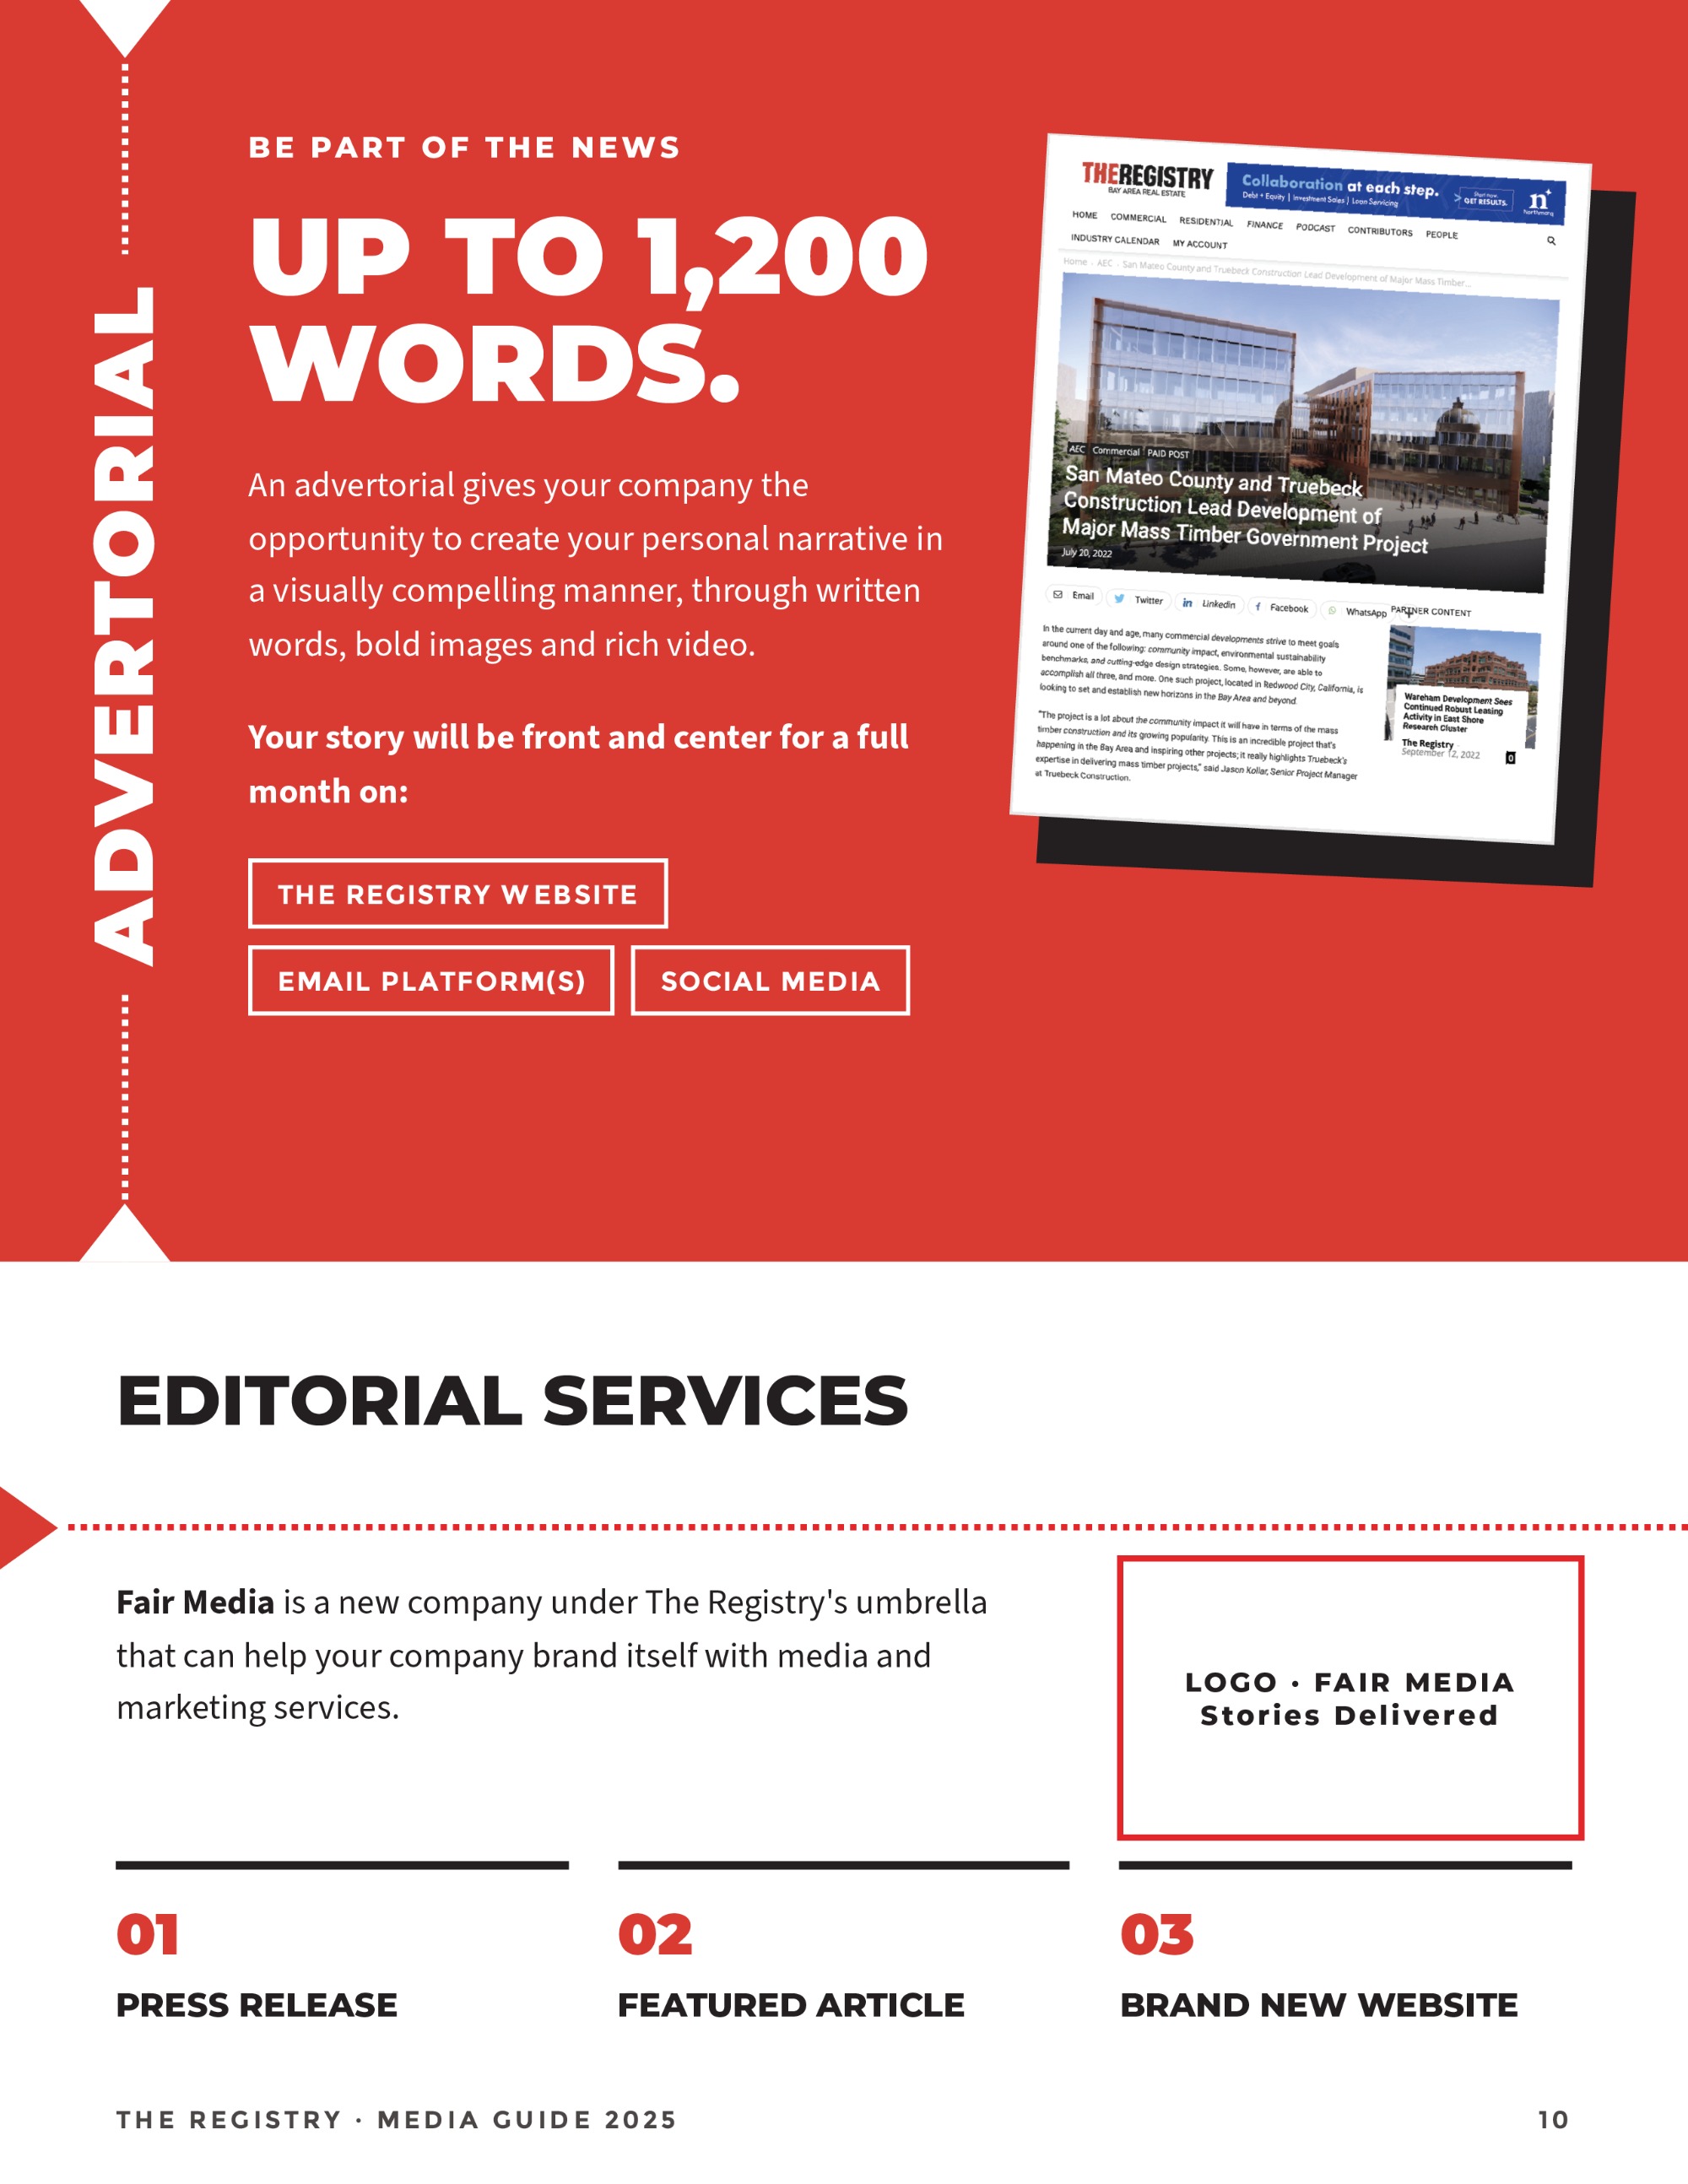
I built a repeatable page system — bold section titles, a red dotted arrow line as the guide’s signature divider, hatched photo frames and a click icon that marks every call to action. Background colour alternates between light, grey and black so each section reads as a new chapter.



Demographics: index, not just percentages
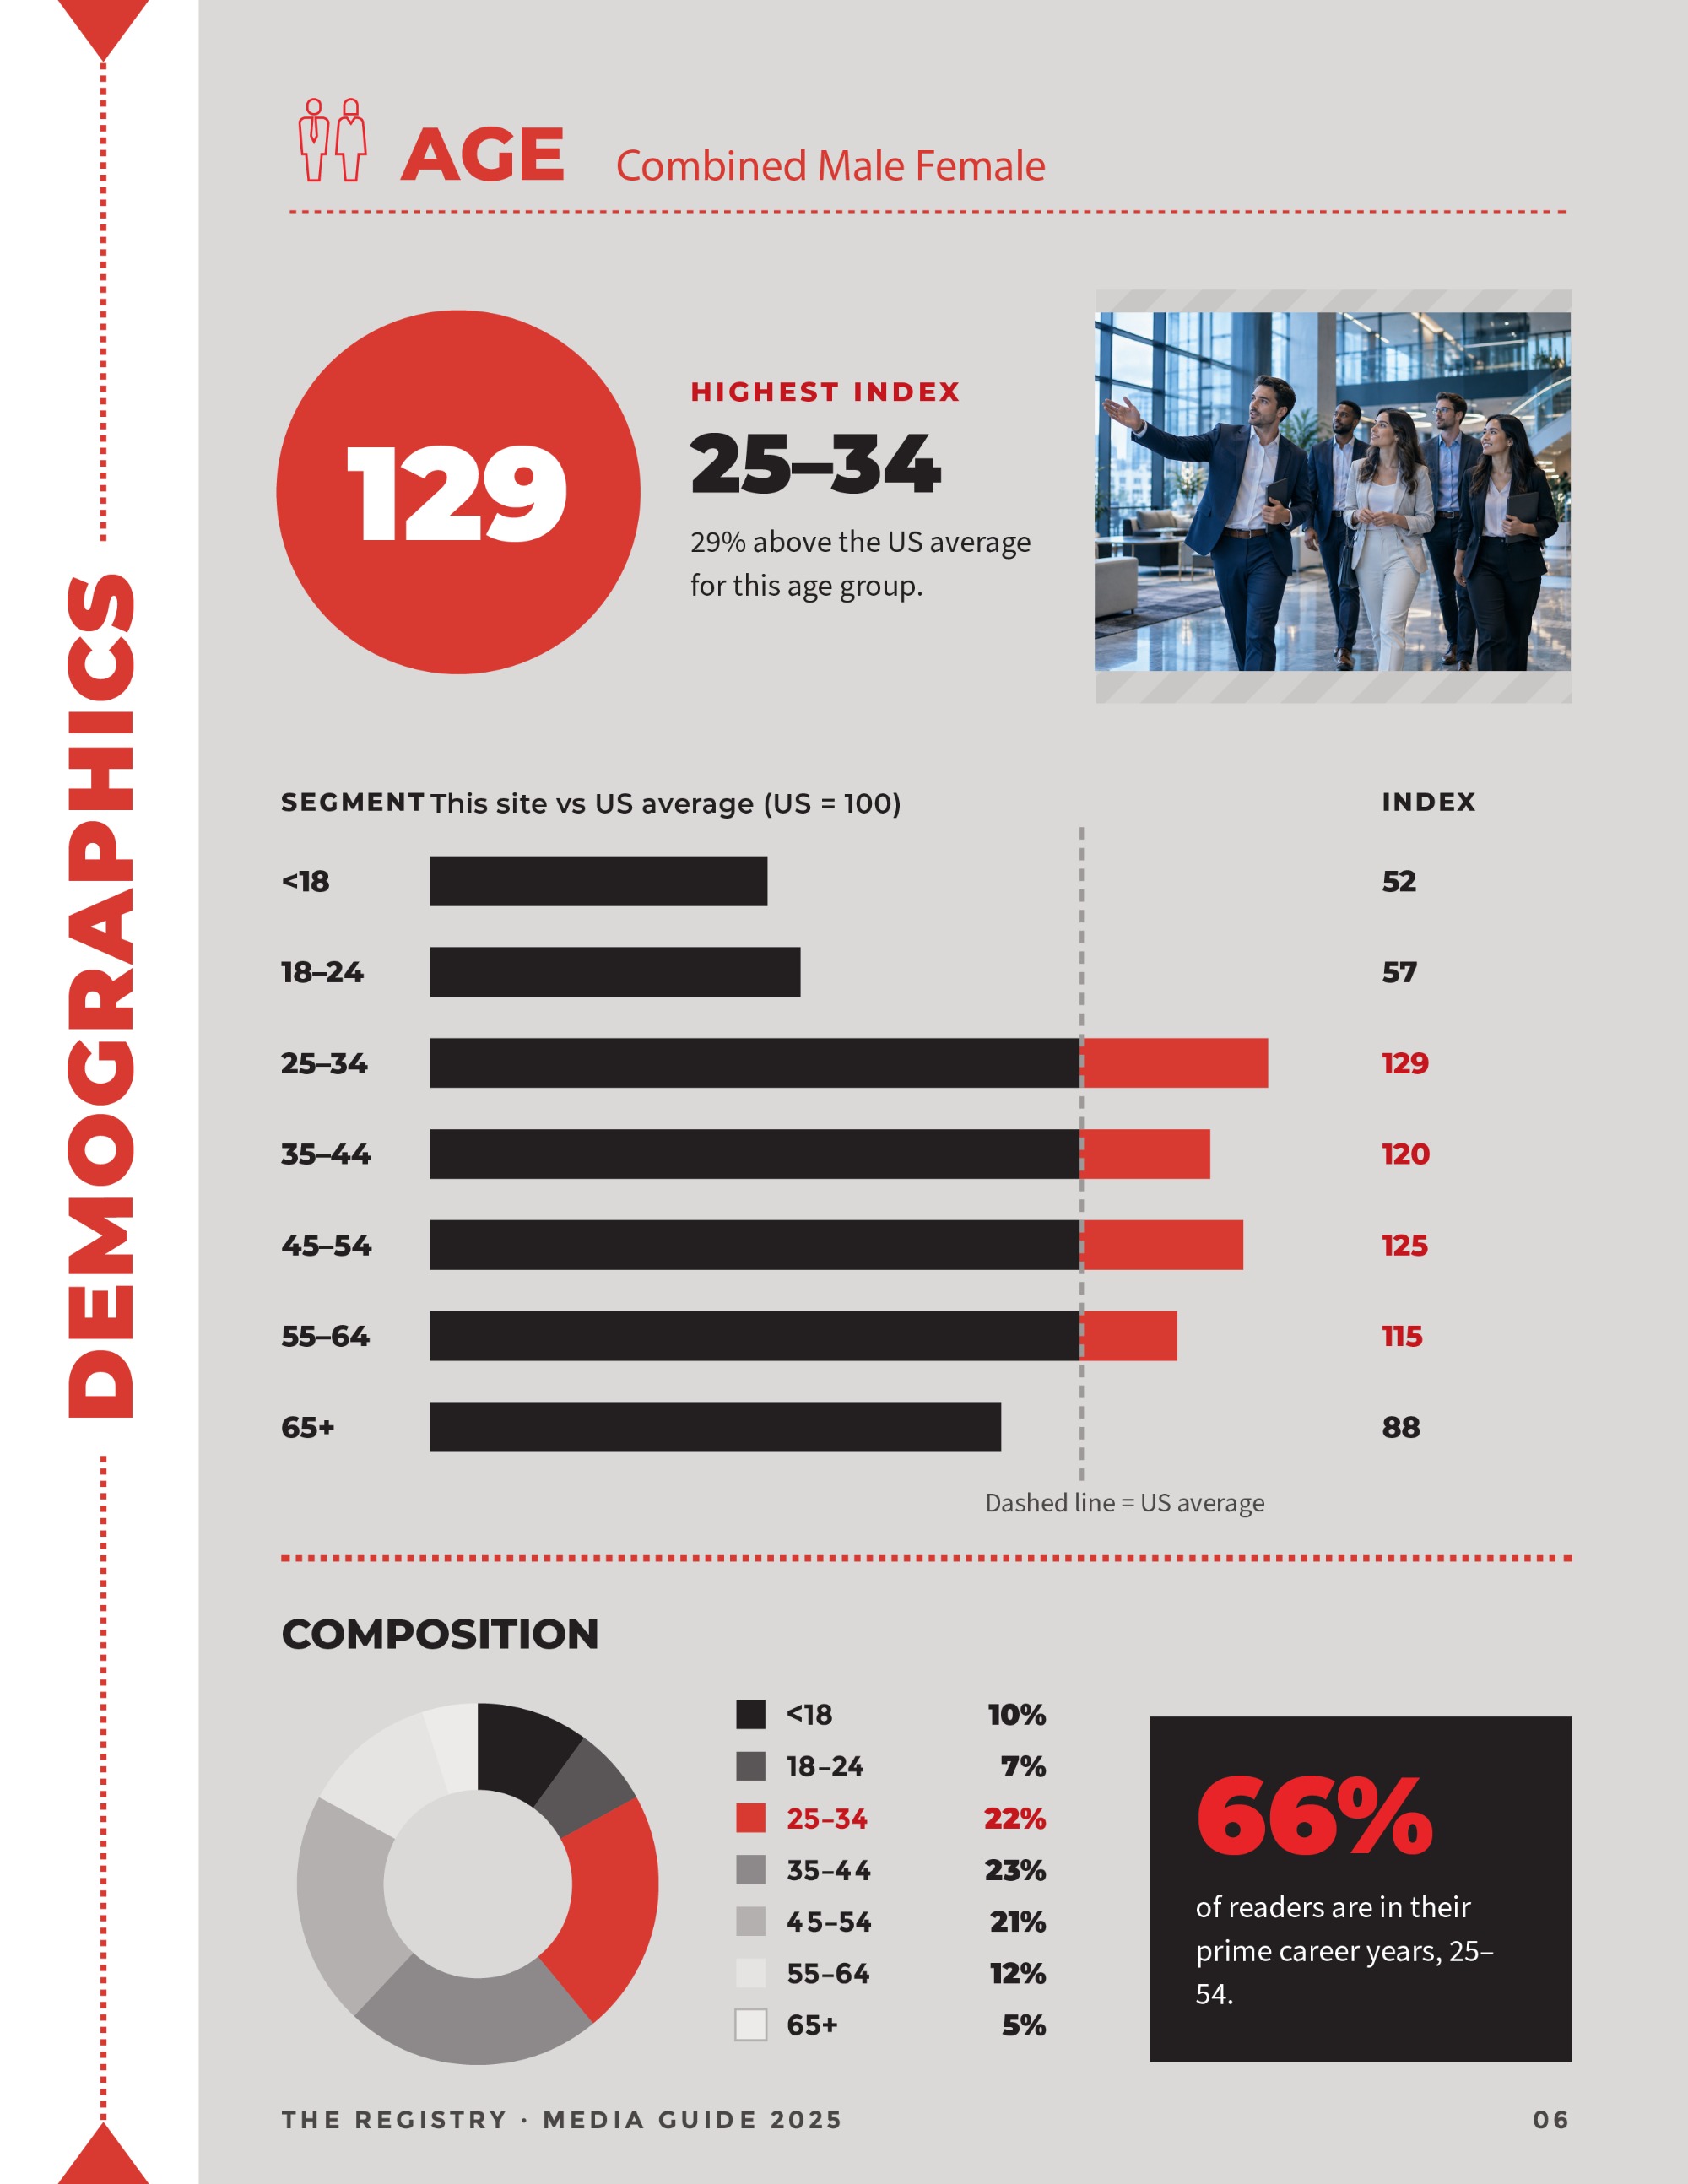
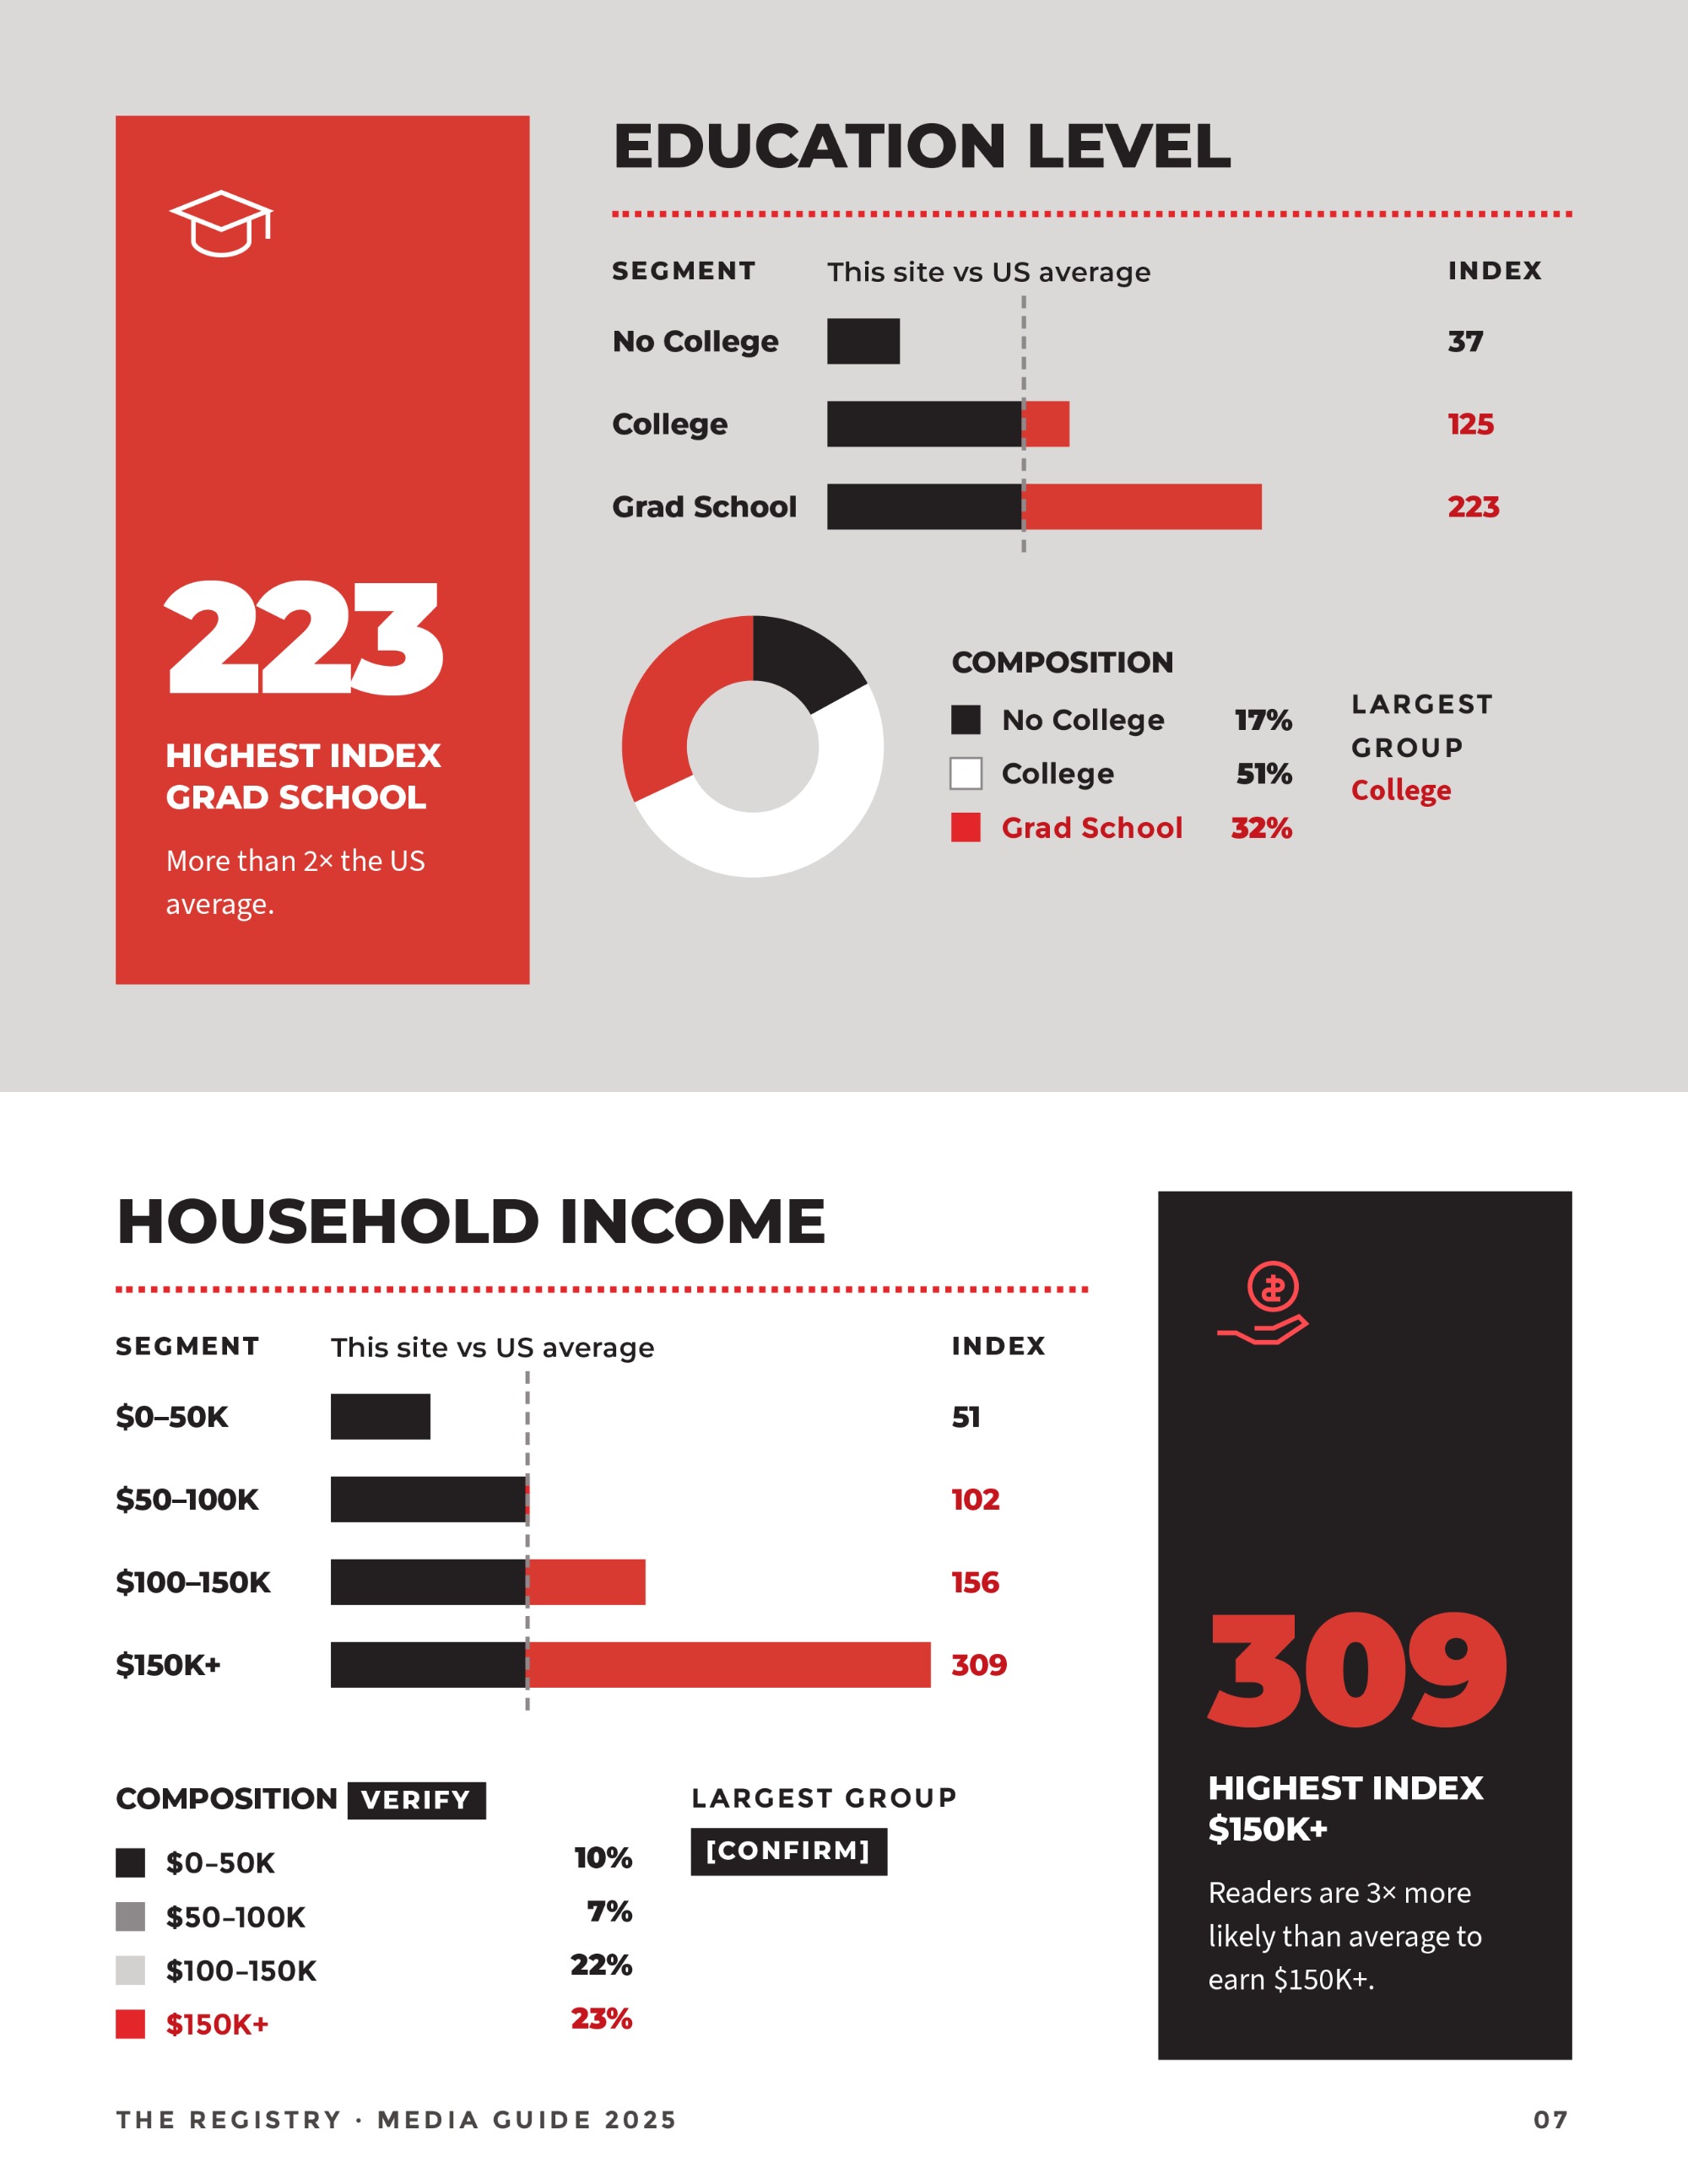
Raw percentages undersell a niche audience. I led with index scores against the US average, so the advertiser sees the edge first.
One reference line on every bar chart; red marks only the share above average.
129, 223 and 309 set huge, so the strongest number lands before the chart.
Paired with each index chart to show size alongside strength.
“66% of readers are in their prime career years” — one sentence a salesperson can quote.
Fifteen pages, one scroll
The same content, rebuilt for the web. The 2024 version carries the full guide, demographics and event calendar included. The 2025 version cuts to the products and the proof, trimming 650 px of height.
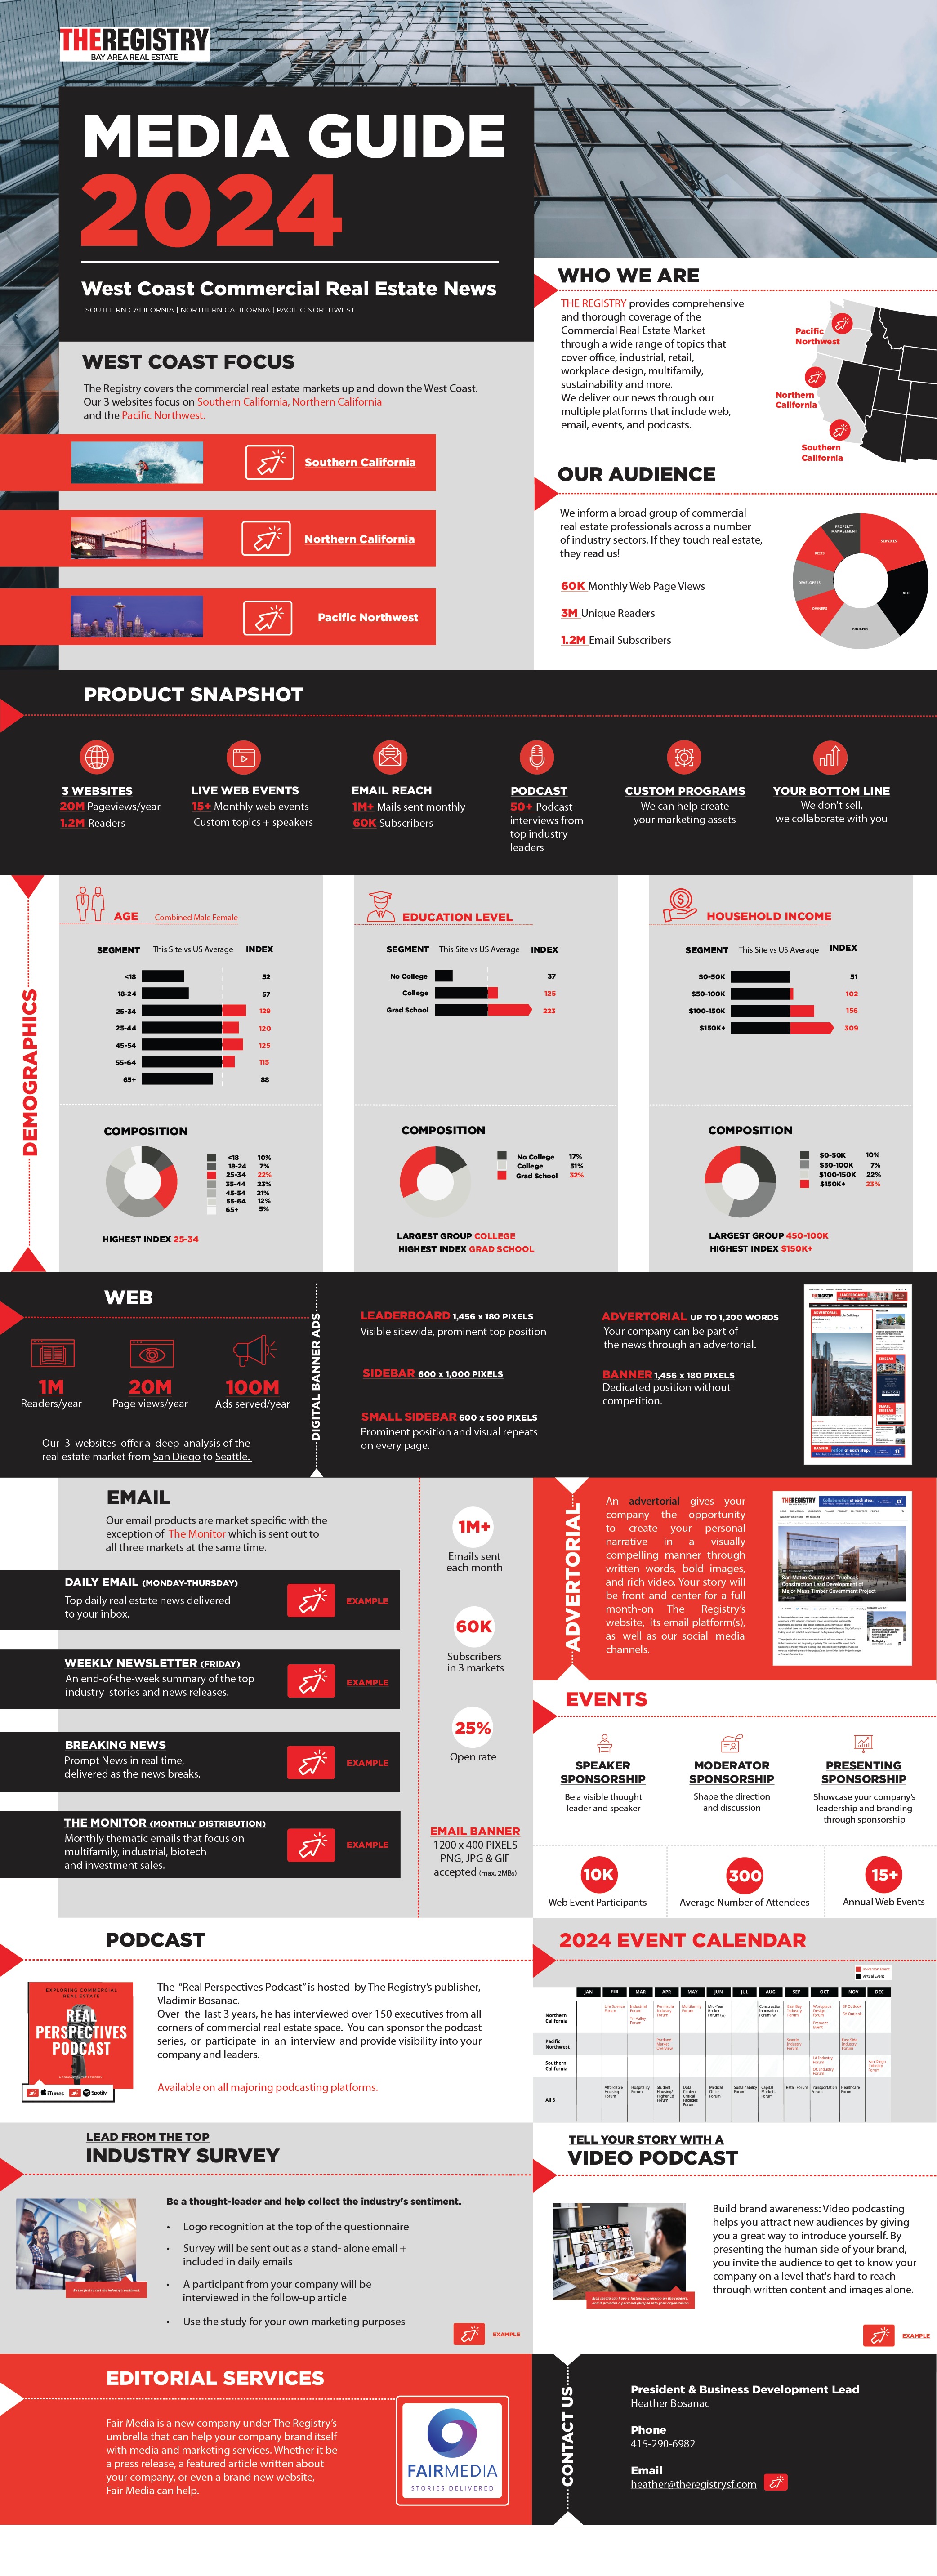
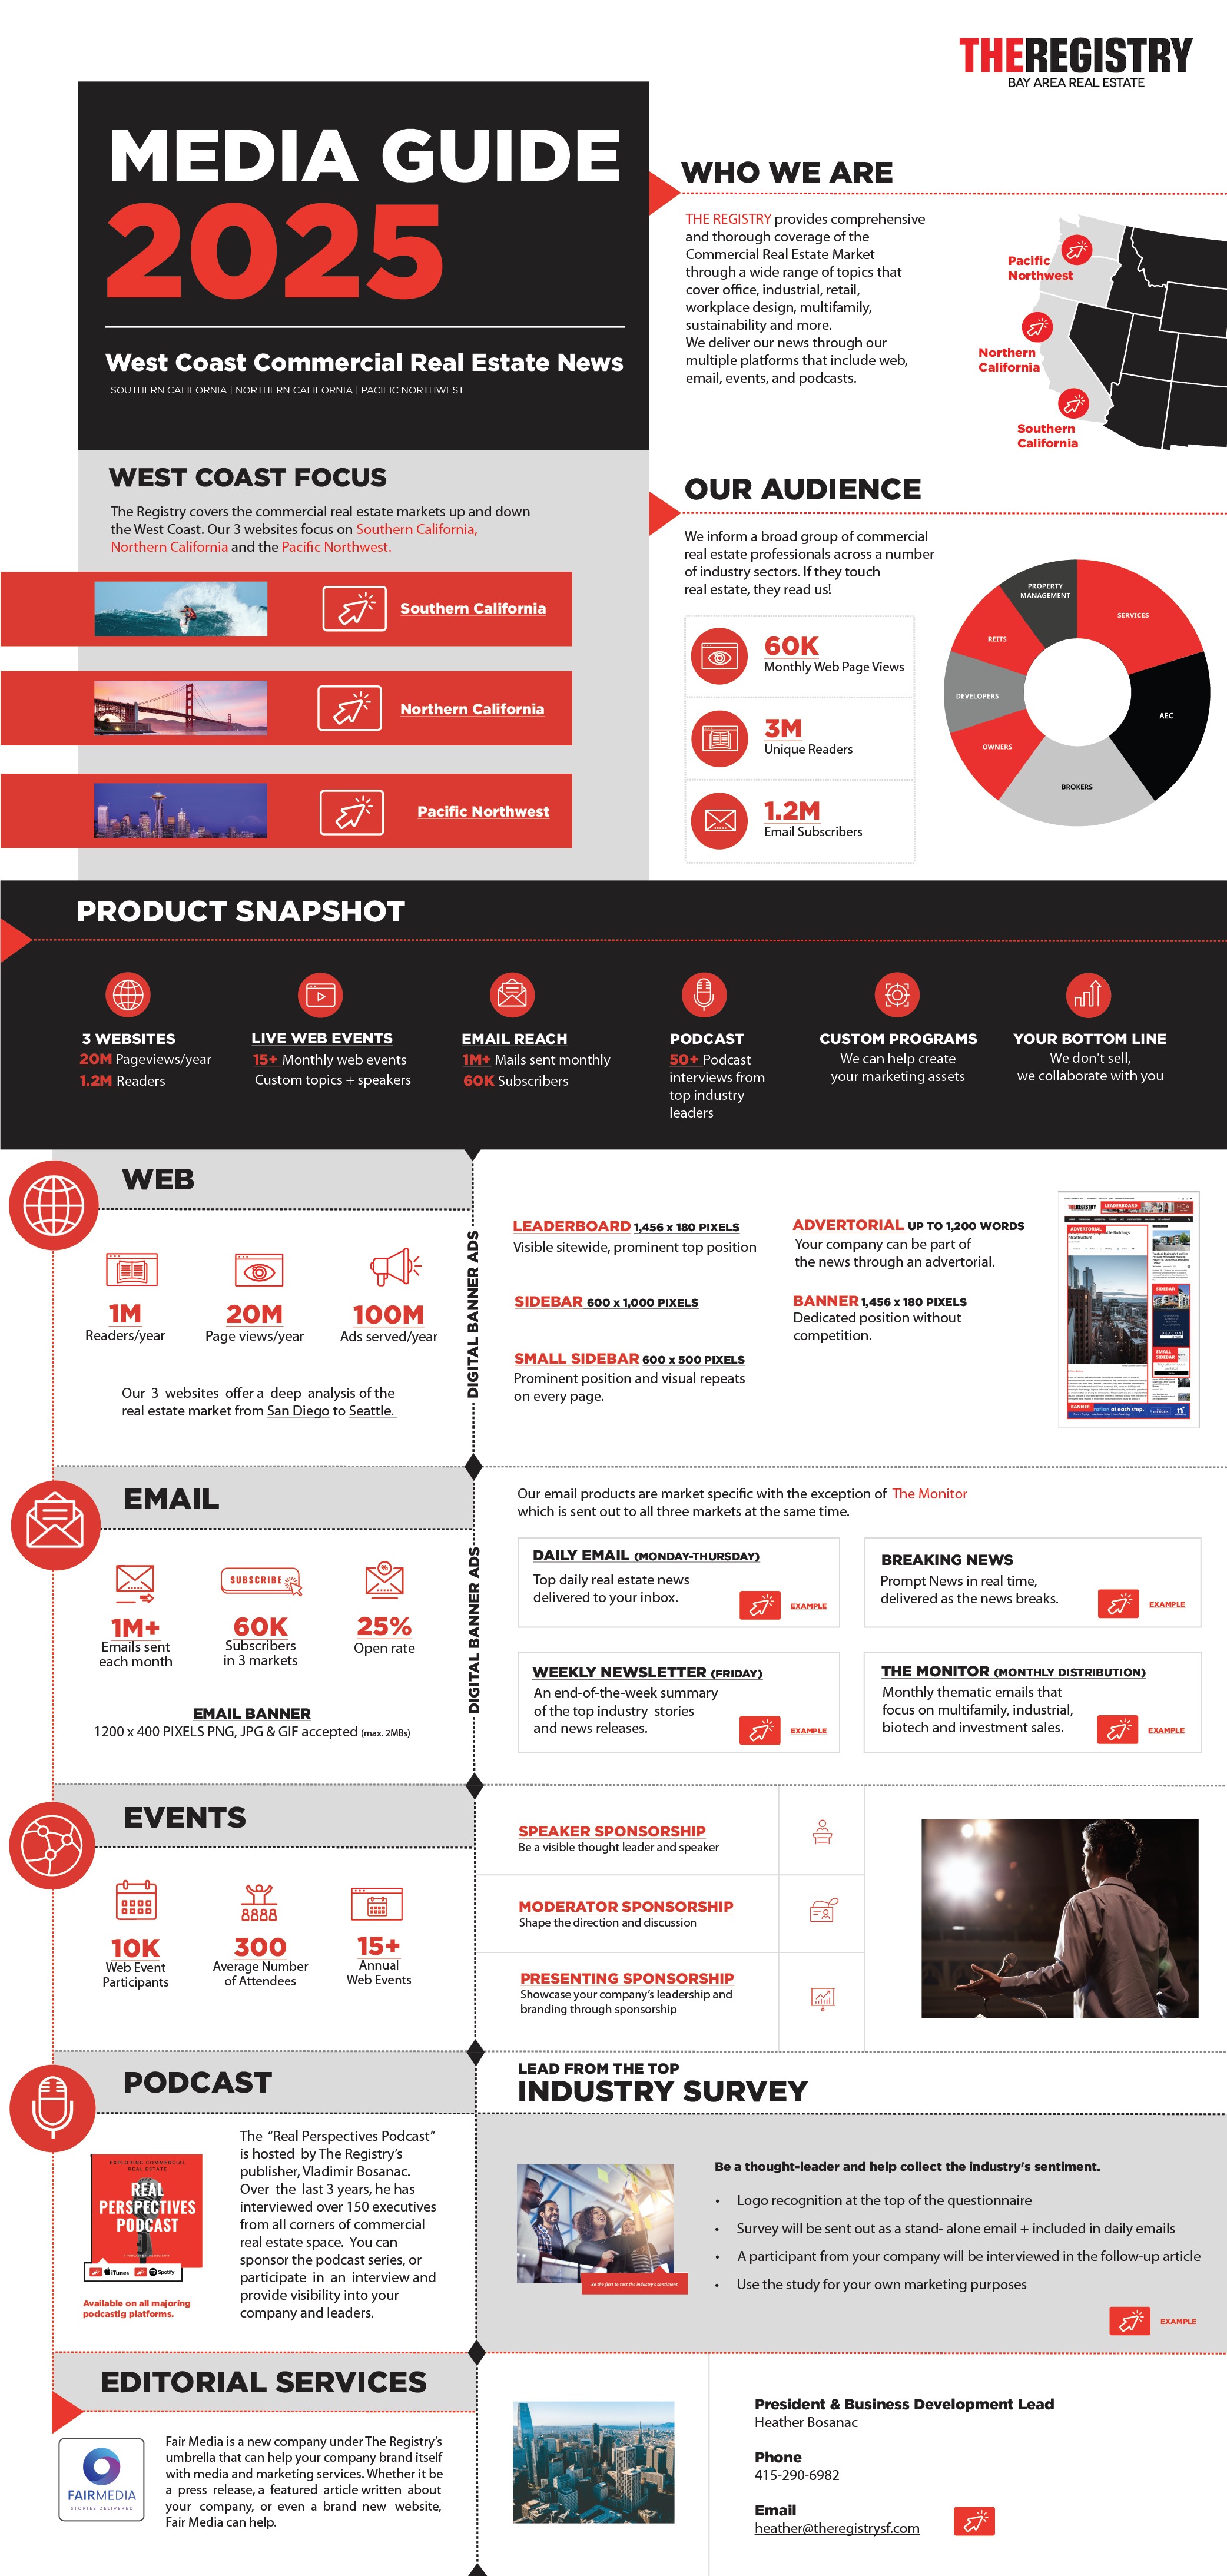
Market map, audience stats, product snapshot, ad specs.
Demographic charts and the full event calendar.
Web, email, events and podcast into one side-tabbed column.
One system, three formats
A full media guide with a clear page for every product.
Long-form 2024 and condensed 2025 versions from the same content.
From who they are to contact, each with its own visual logic.
Southern California, Northern California and the Pacific Northwest.
The goal was never decoration. It was a guide a salesperson can open to any page and close a conversation with.


