

Turning dense orthopedic data into trusted web content
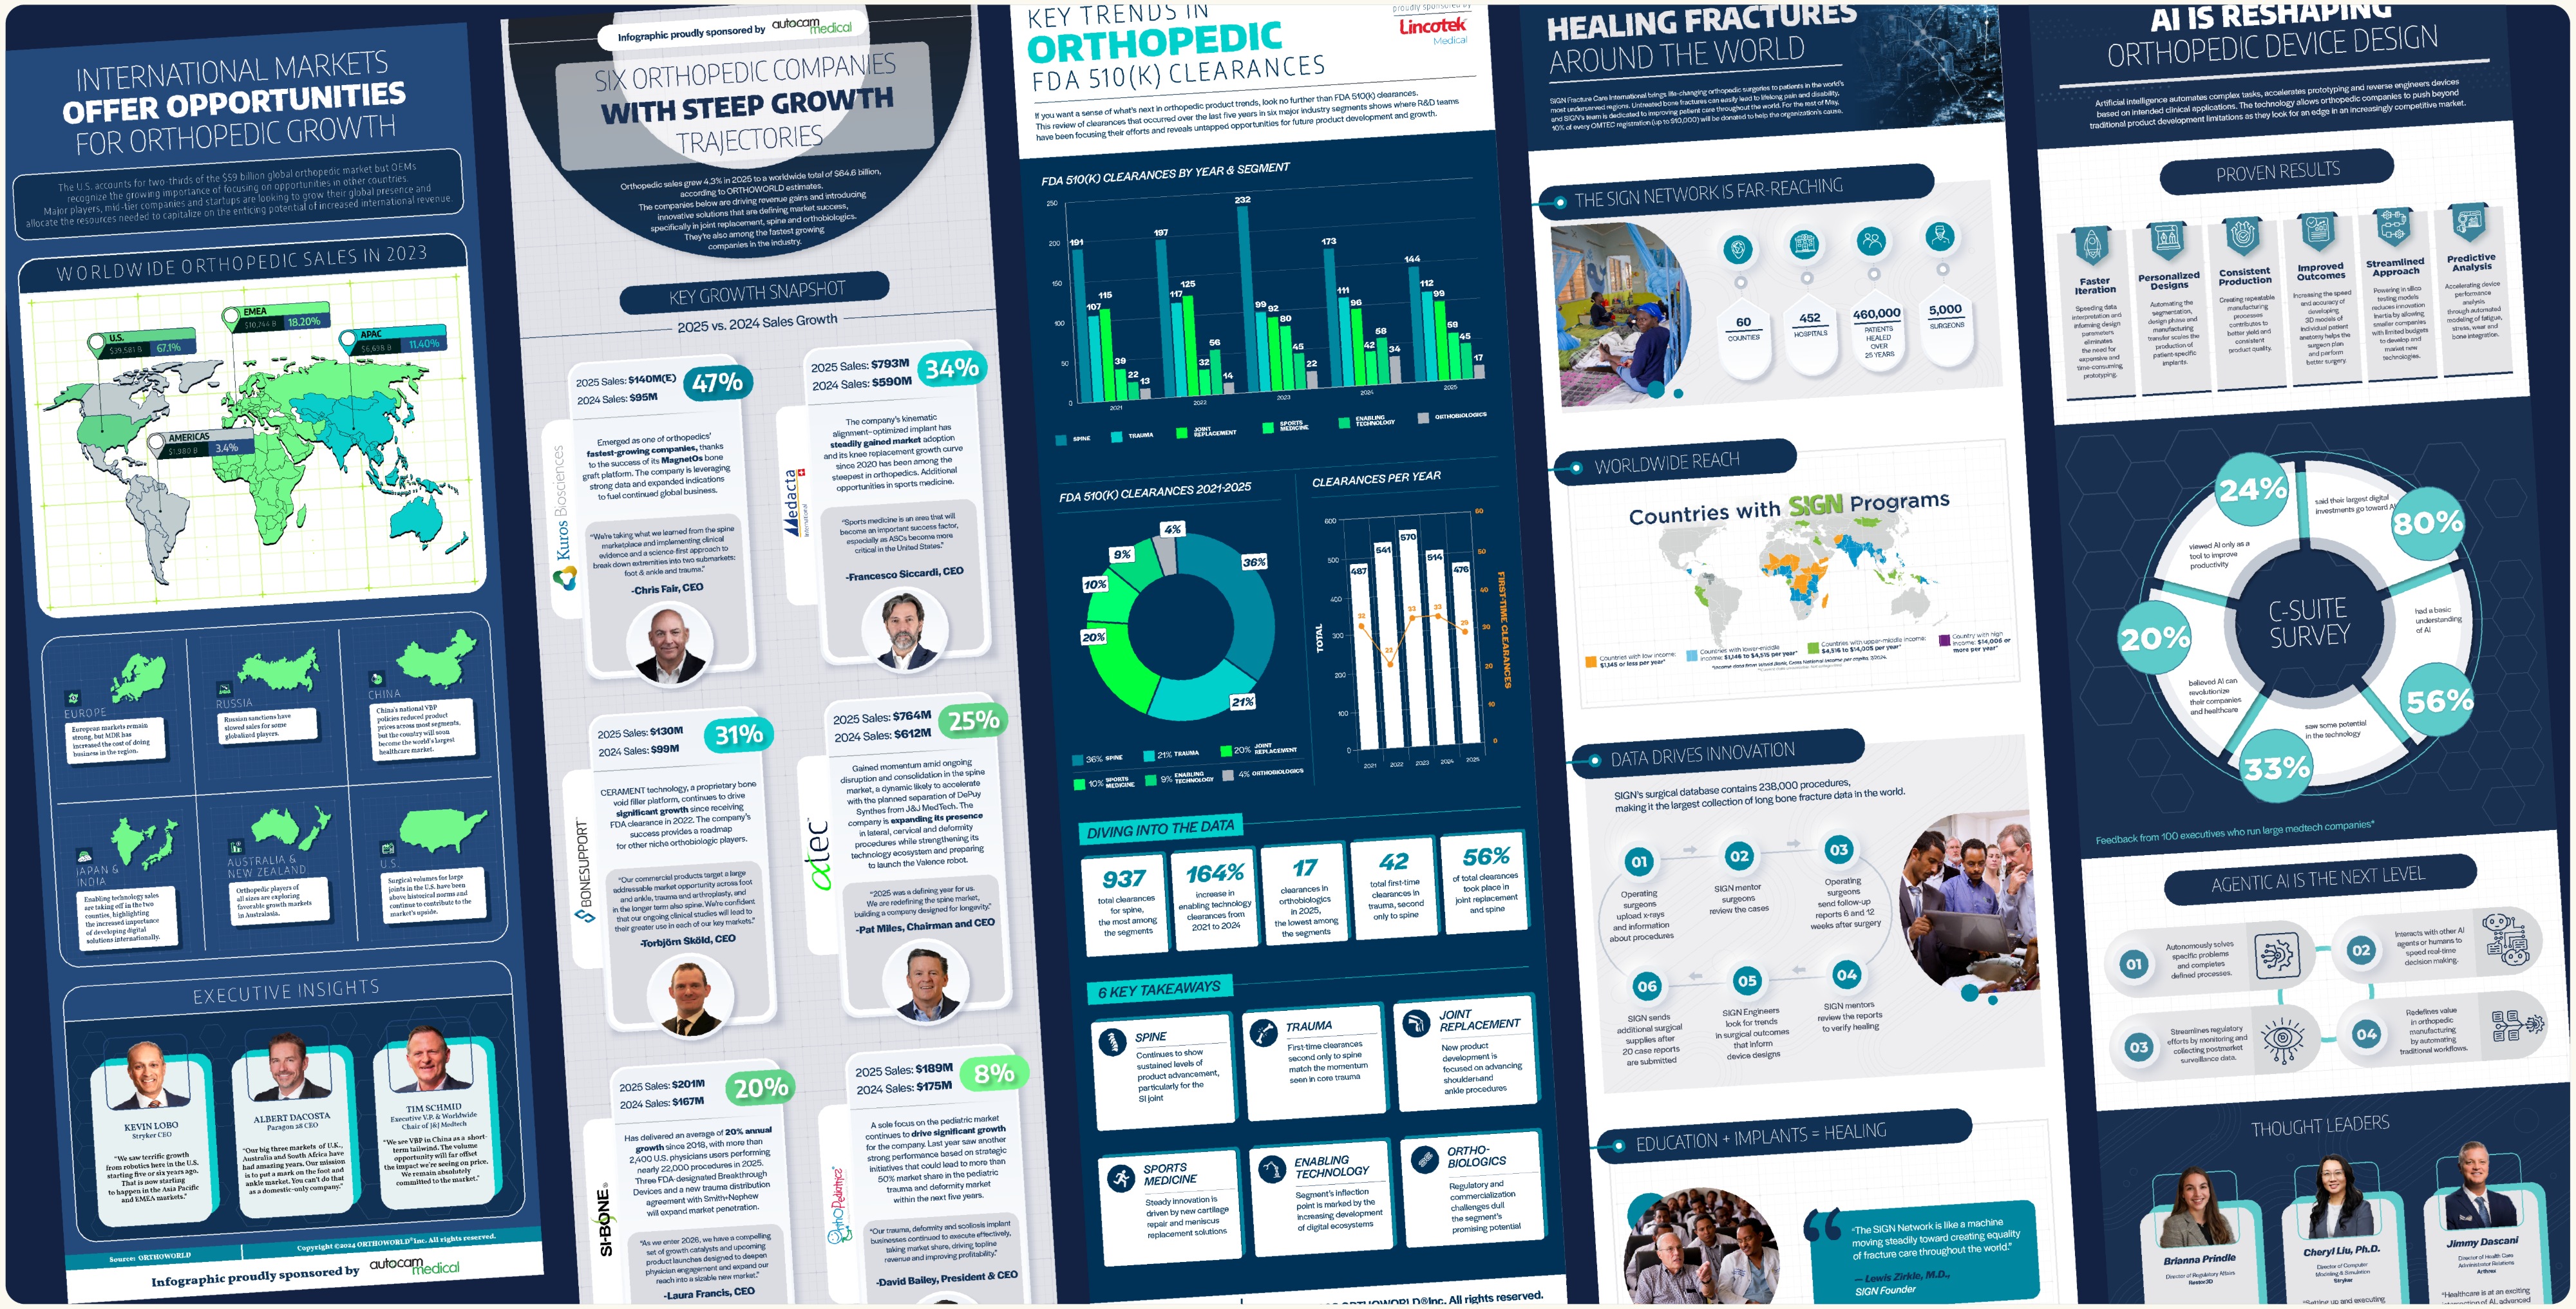
A recurring data-visualization partnership with ORTHOWORLD and BONEZONE, the orthopedic device industry's leading online resource — 36 web infographics delivered, ten selected here.
ORTHOWORLD needed web content that turns technical, often dry industry data into visuals a time-strapped orthopedic executive would actually stop and read.
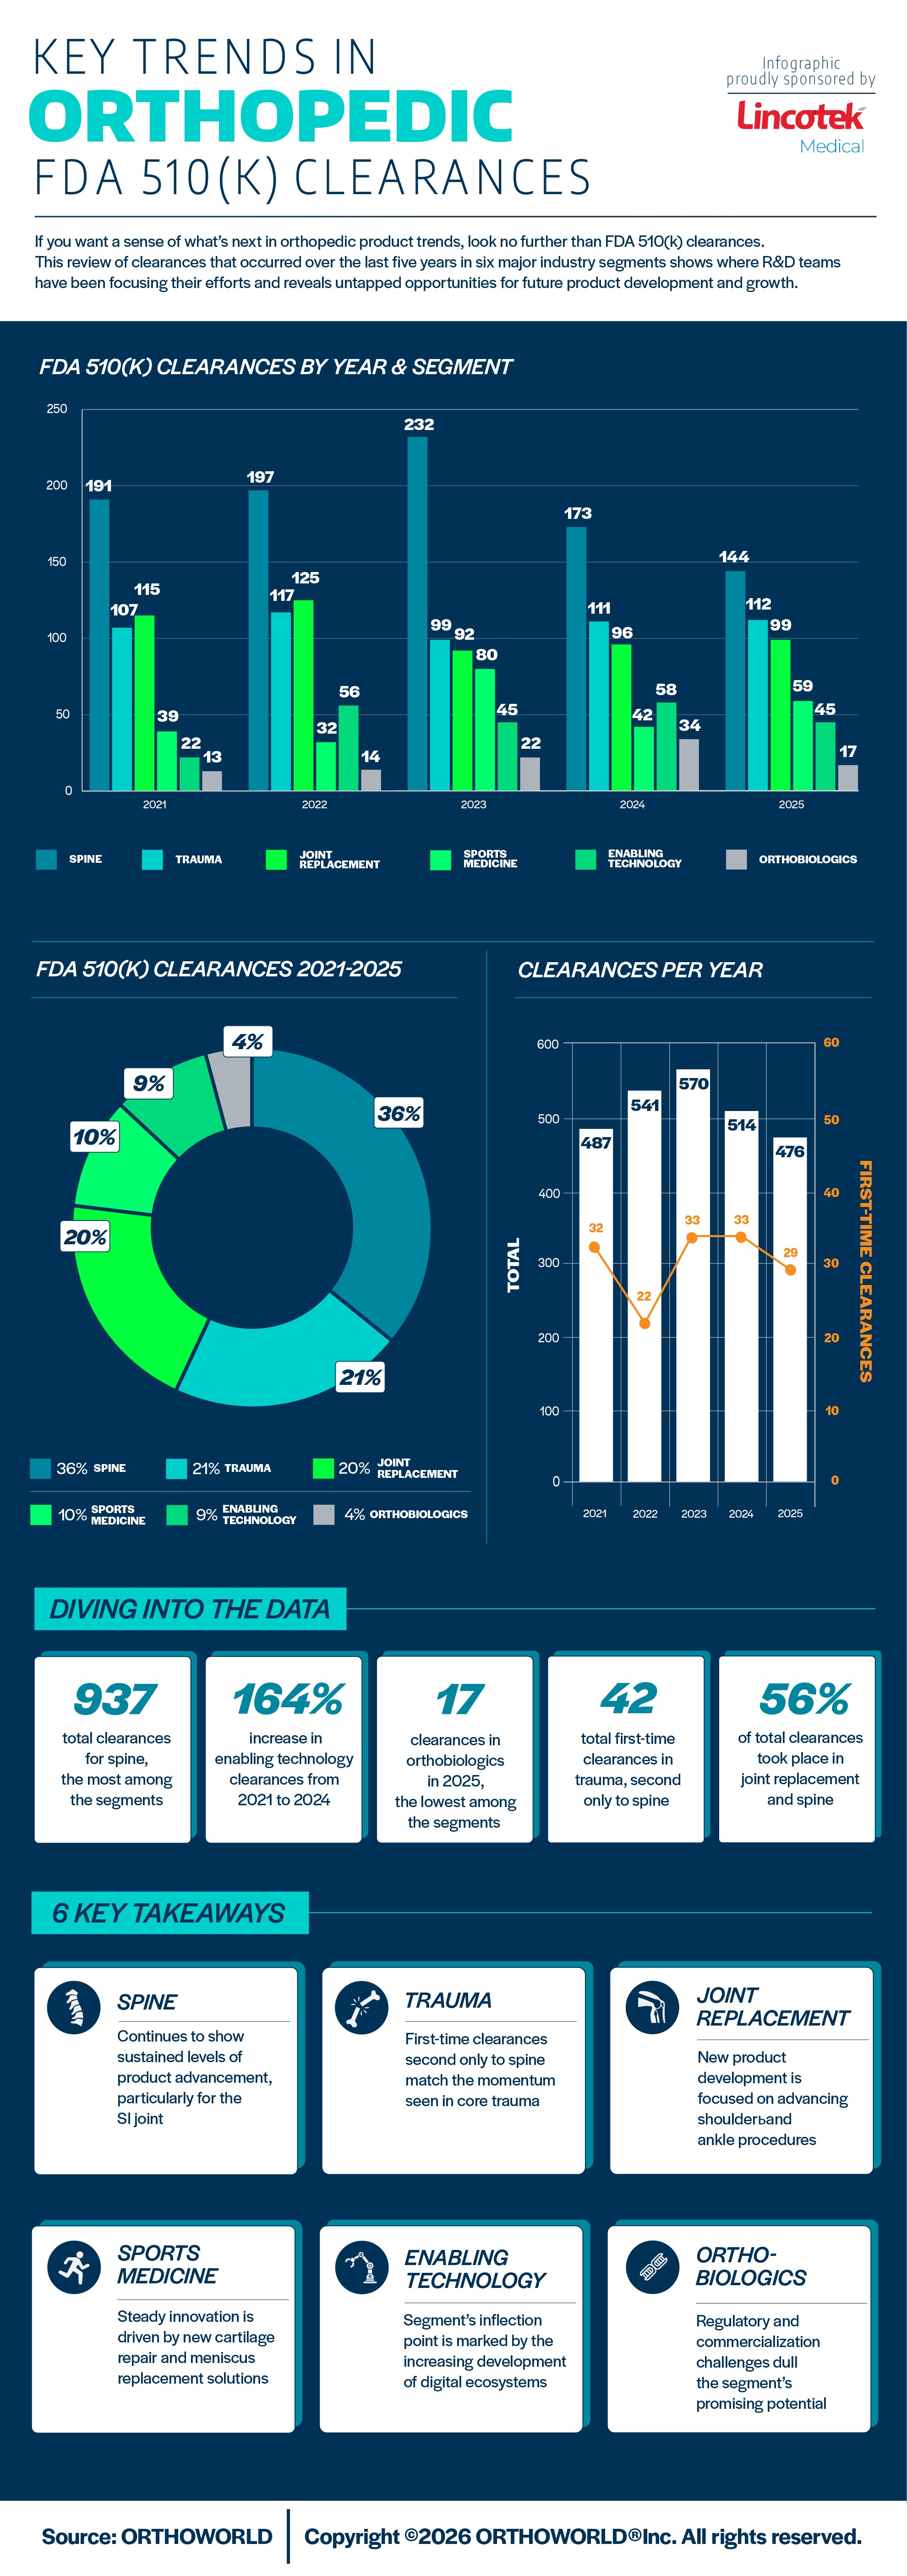
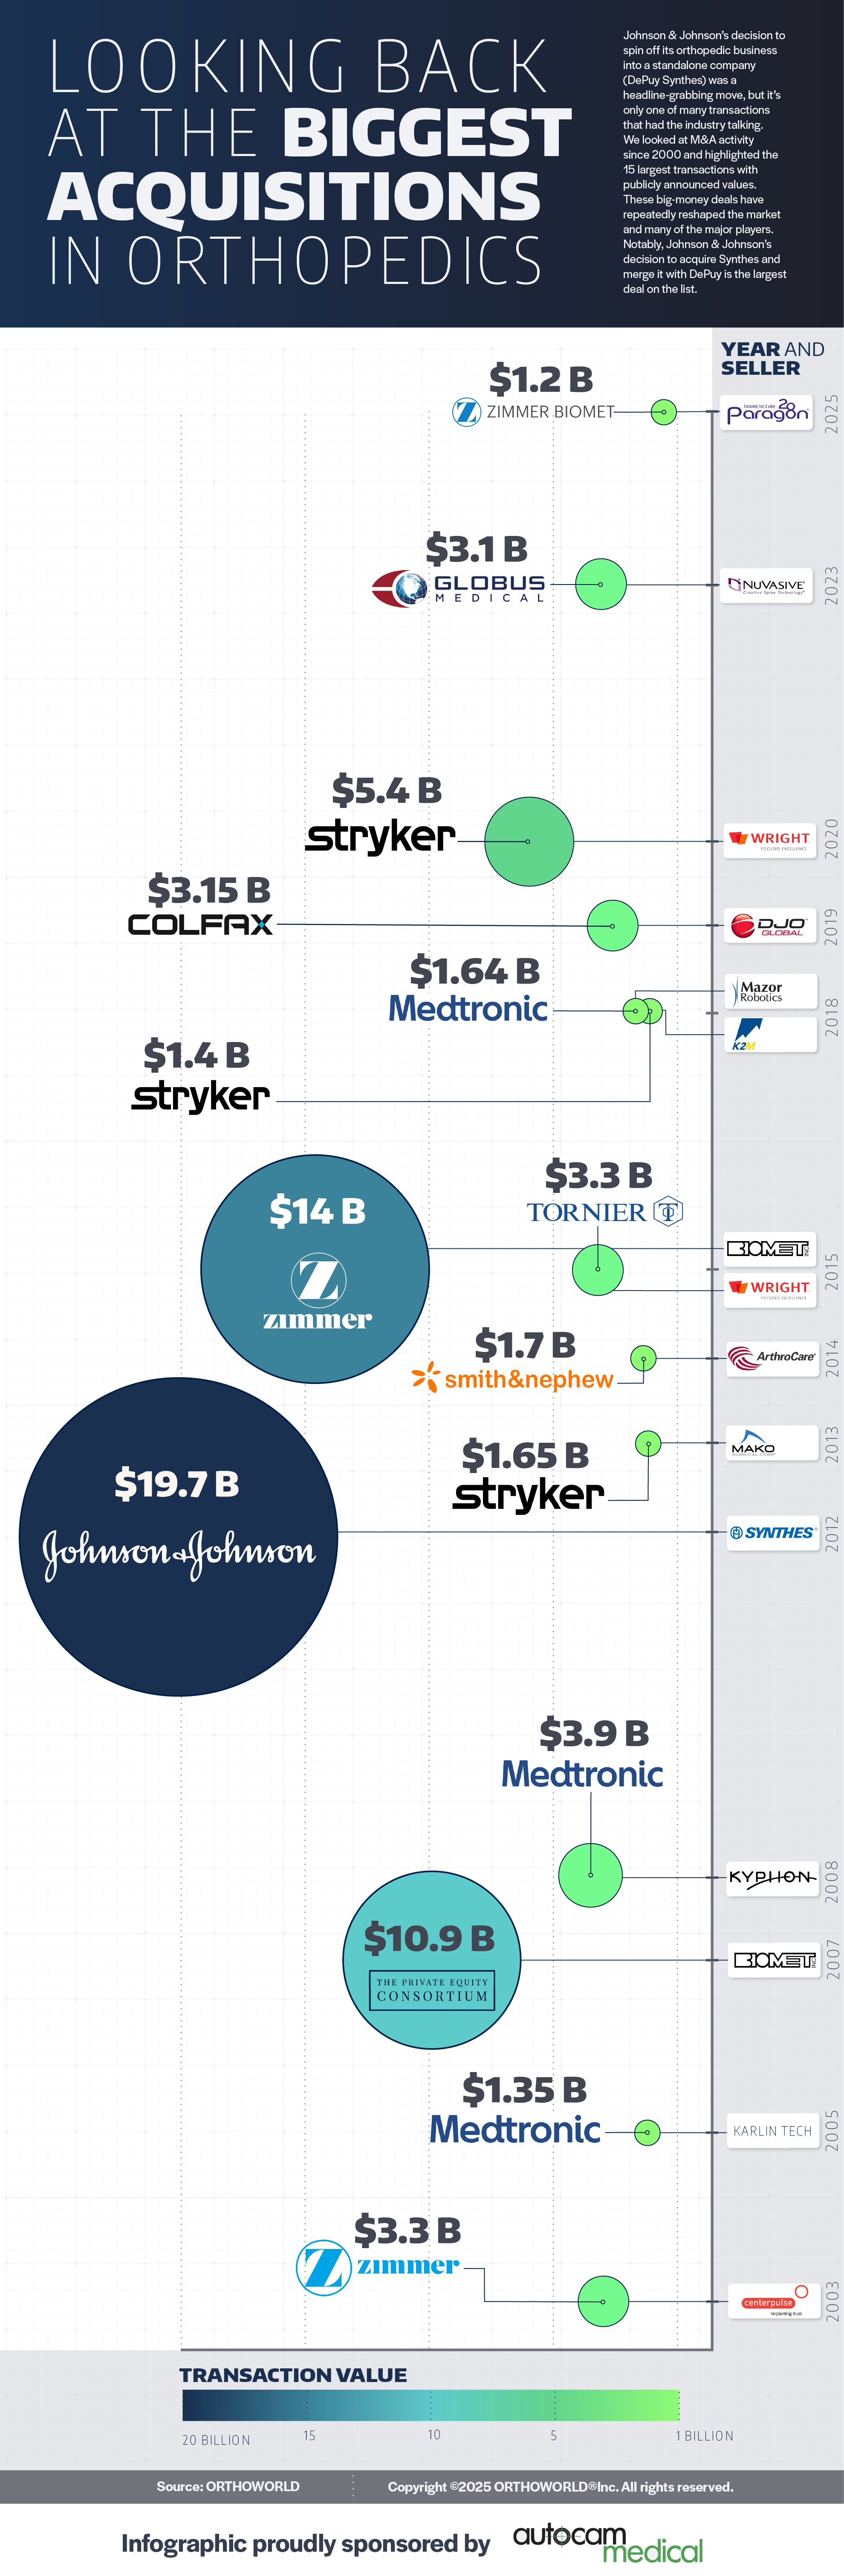
As their recurring infographic designer, I translated loose briefs and raw data into 36 sponsor-ready web infographics. The ten selected here span distinct data stories — regulatory deadlines, M&A activity, FDA clearance trends, tariff policy, market sizing, and clinical outcomes.
Each piece got the chart form its data actually needed. The result: a production pipeline the team could hand a brief to and trust — brief after brief, without babysitting the process.
Every piece had to serve two masters: inform a technical, skeptical readership — and carry a paying sponsor's name credibly.
The orthopedic industry's go-to source online
ORTHOWORLD Inc. runs BONEZONE, the orthopedic device industry's primary trade media brand, alongside its trade show, OMTEC. The infographics were built for and published on their website.
I worked directly with GM & Co-Owner April Bright and Senior Editor Dan Cook, who commission data-driven infographics as both standalone web content and sponsor-branded assets.
Raw inputs, three constraints
Source material was rarely design-ready — dense copy, loose bullet points, sometimes just a data source and a rough verbal idea.
Every piece had to hold against a locked brand system, a readership that would notice misrepresented data, and — for sponsored pieces — an advertiser's name attached to the outcome.
Navy, green and teal palette and type held constant across ten very different topics.
Regulatory and industry professionals who notice a misrepresented axis immediately.
Paid placements meant every graphic had to meet a commercial bar, not just a content one.
Ten selected stories. Ten structures. One system.
Ten of the 36 pieces, chosen to show range. I made the visualization-form decision for every piece individually — matching the chart to what the data needed to say, instead of reusing one template. Every piece was built as a long vertical format, made to be scrolled on the web.
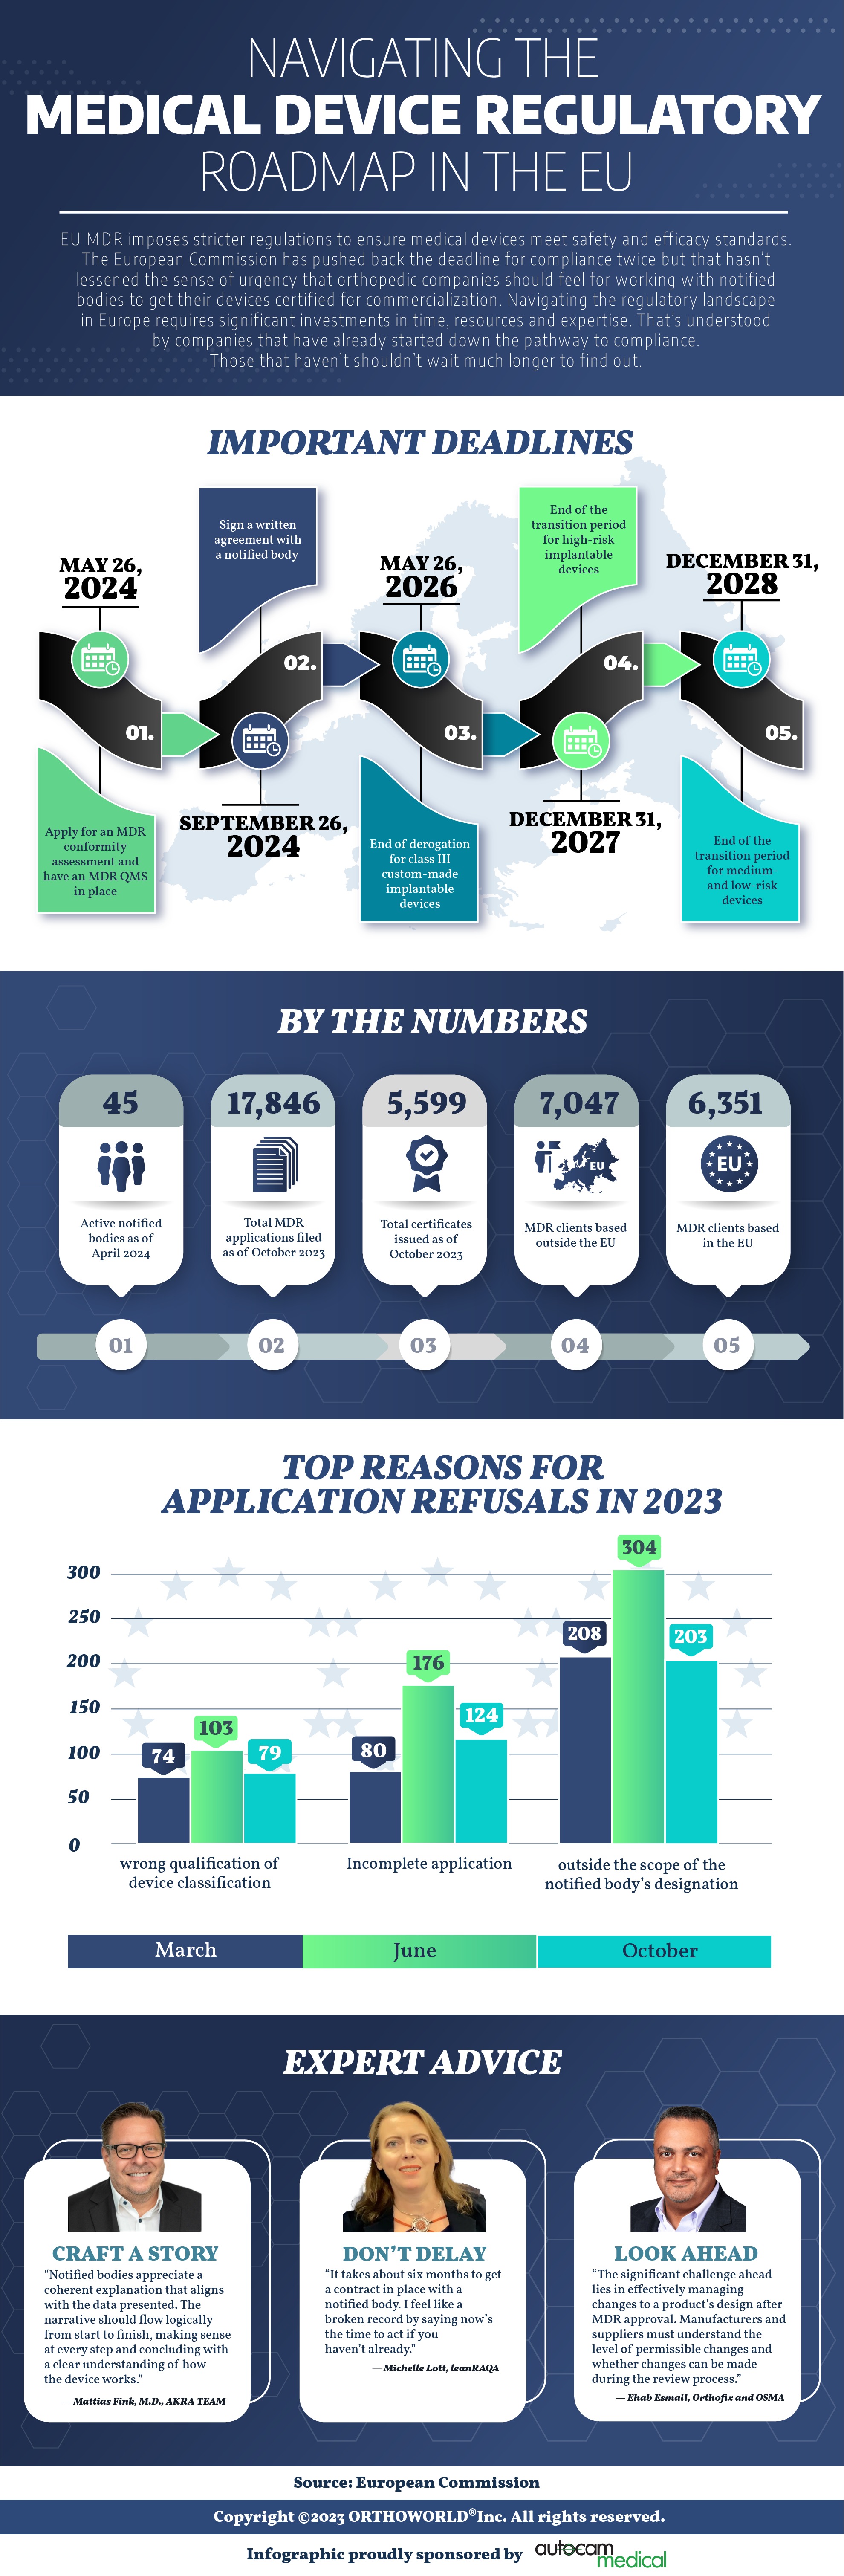

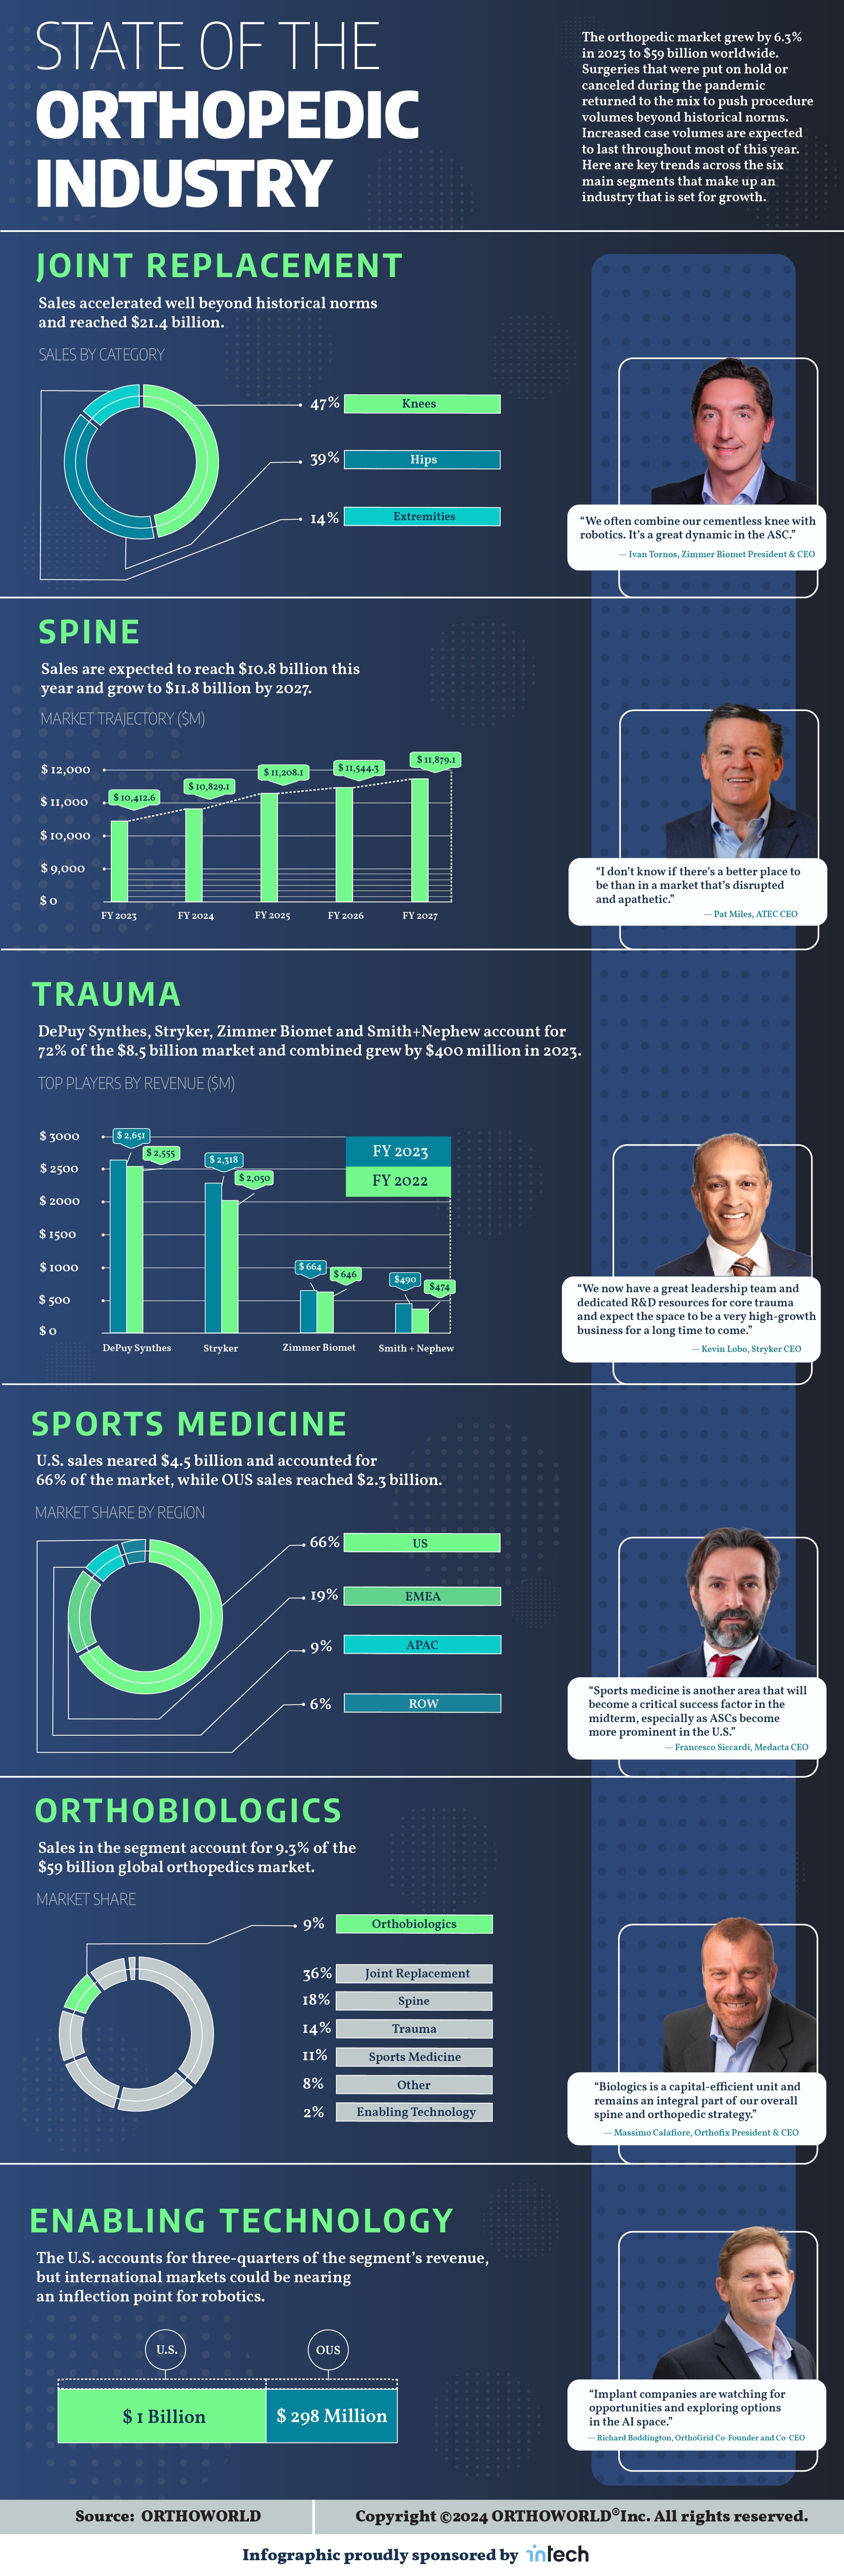
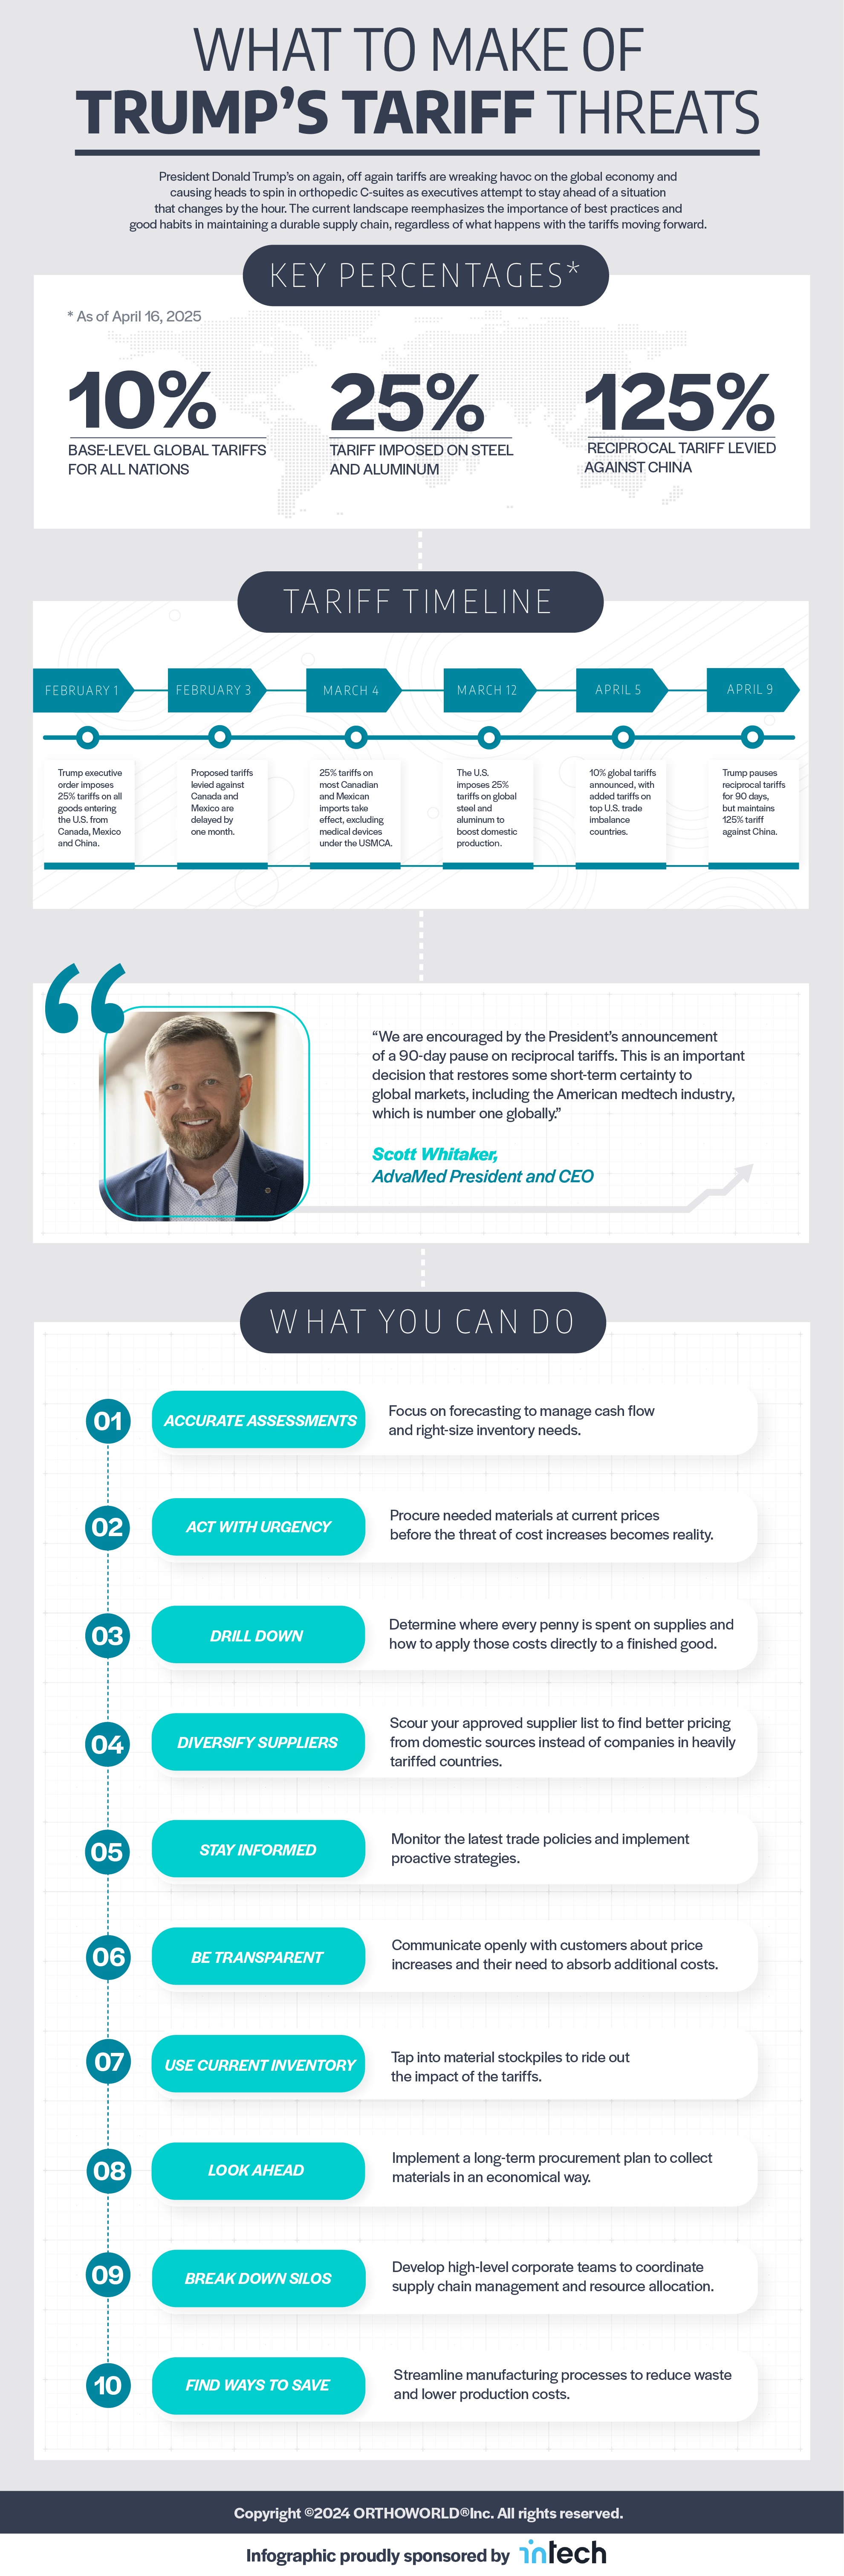
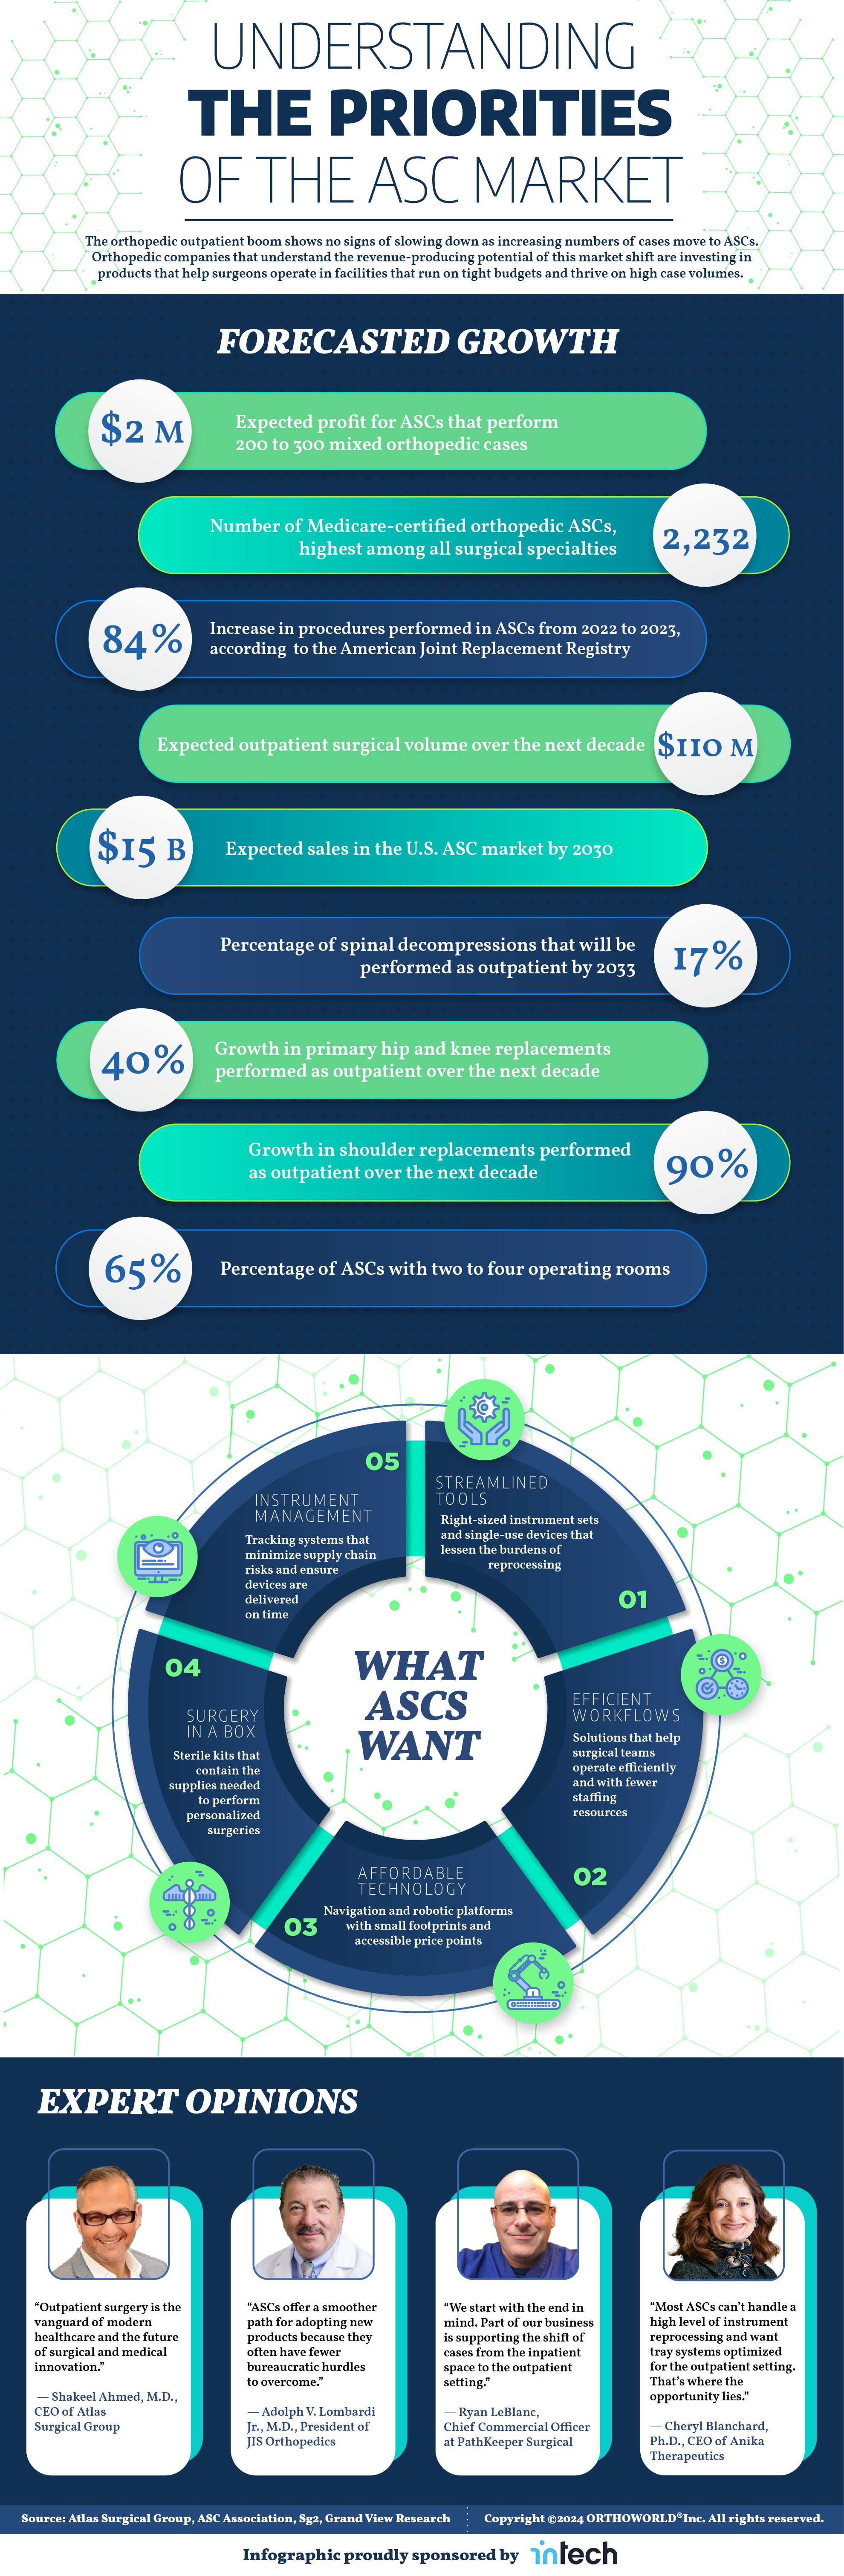

EU MDR Regulatory Roadmap
The most demanding piece in the series — four content systems held together in one legible scroll for a regulatory-affairs audience.
Deadlines from 2024 to 2028 set on a numbered, map-anchored path so the sequence reads at a glance.
Five headline figures paired with simple icons, giving skimmers the scale before the detail.
Application-refusal reasons compared across three reporting periods on a shared axis.
Quotes from regulatory experts close the piece with actionable advice, not just data.
From a verbal idea to a closed loop
The SIGN Fracture Care brief described the case-review cycle as loose, verbal direction. Deciding what became an icon, what became a number, and where the loop needed to visibly close — that was the work.
“I'm picturing arrows pointing to boxes containing each step to represent a feedback loop.”
Each step of the review cycle got its own mark.
Five figures promoted to a scannable stat row.
Arrows close visibly back to the start.
Same brand, different shape every time
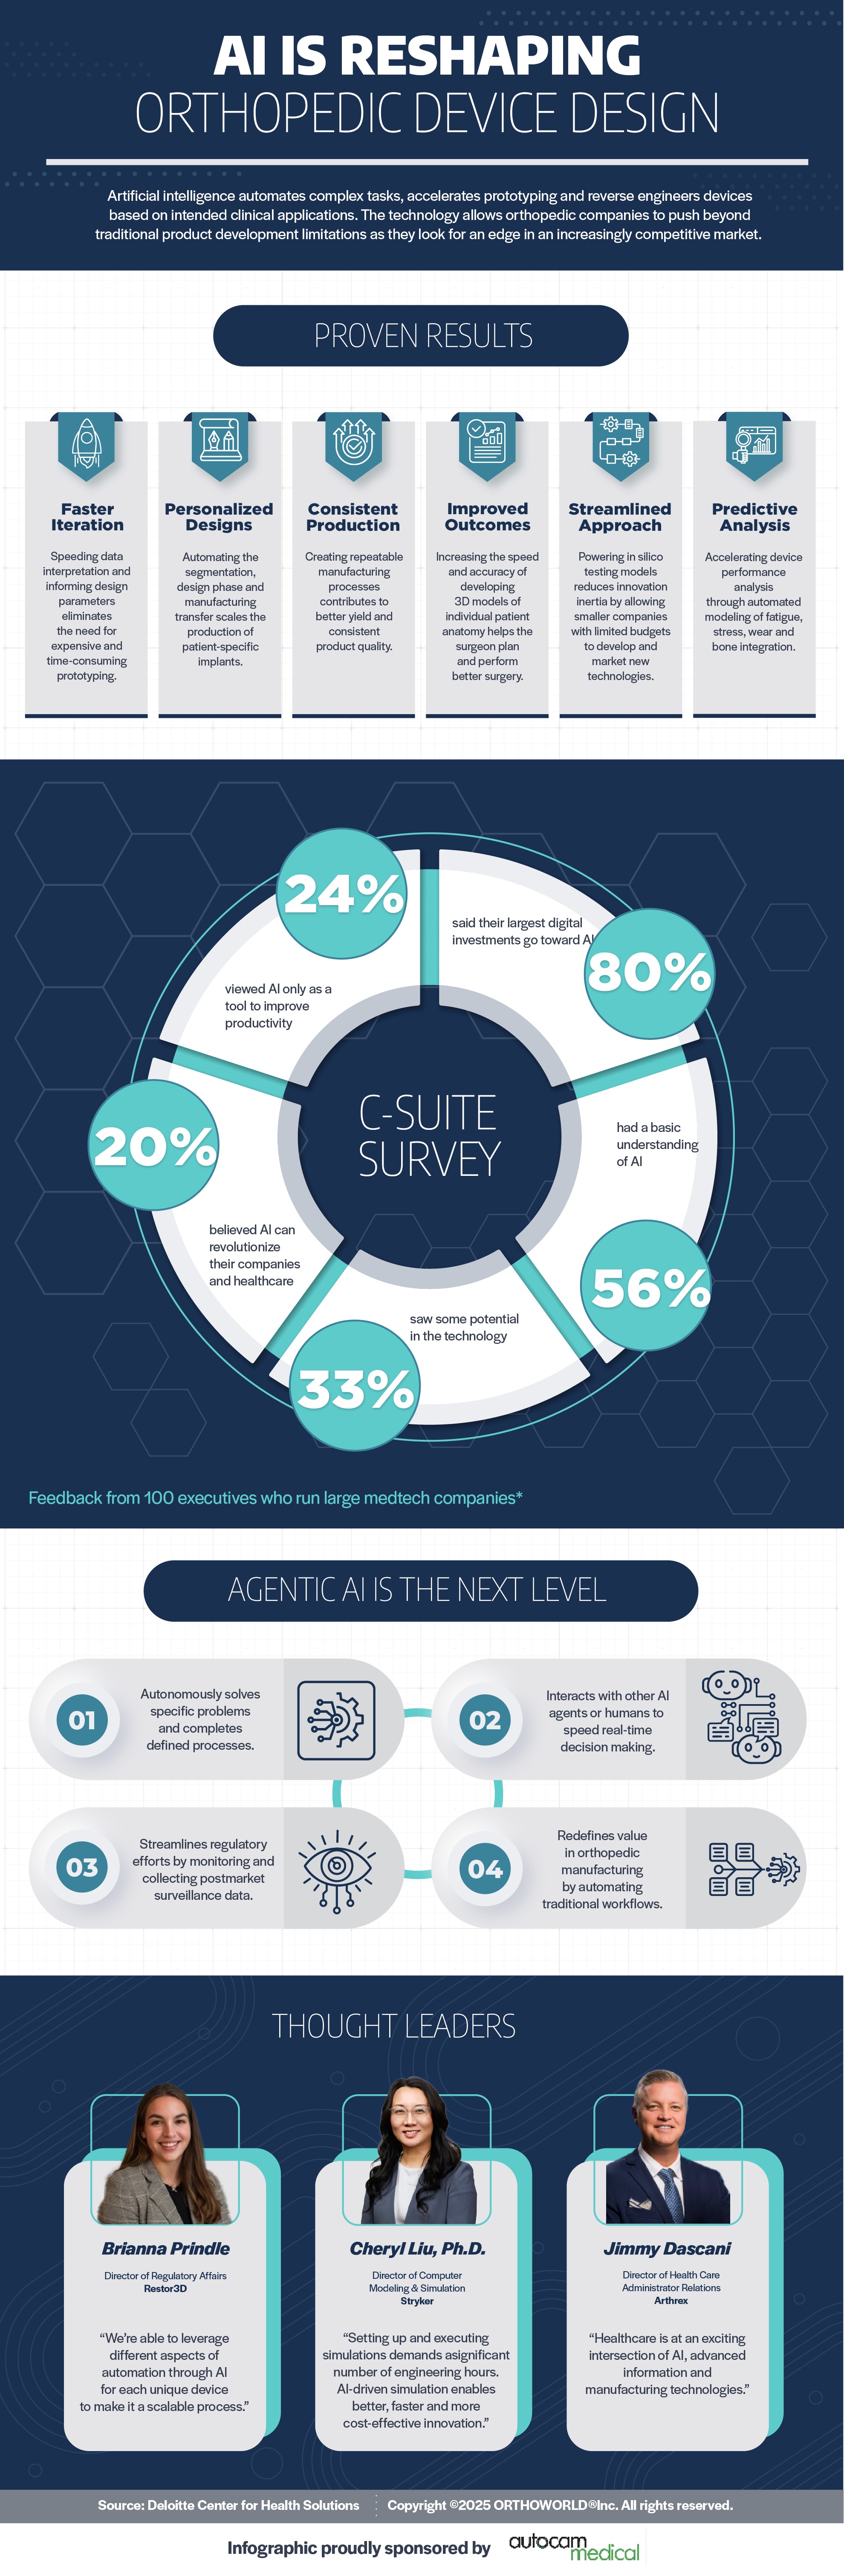

A pipeline the team trusts
A recurring series built brief after brief — ten selected for this case study.
Brief to final file, across a technically demanding series.
One chosen per data story across the ten selected pieces — no repeated template.
Meeting a content and a commercial bar at once.
ORTHOWORLD came back with brief after brief, not a single project. A recurring commission is the strongest evidence of trust a freelance relationship produces.


